Reminder of some analytical concepts example on AMCSince July 29 at 5:00 p.m. the vwap indicator has been broken and we have had an uptrend. In addition, on August 1st the market came to have a spring effect on the vwap indicator and starded to rise again. During this same day ( August 1st) we had yet another spring effect on the vwap indicator , thus pushing the market on a very nice trend.Thanks.
AMC trade ideas

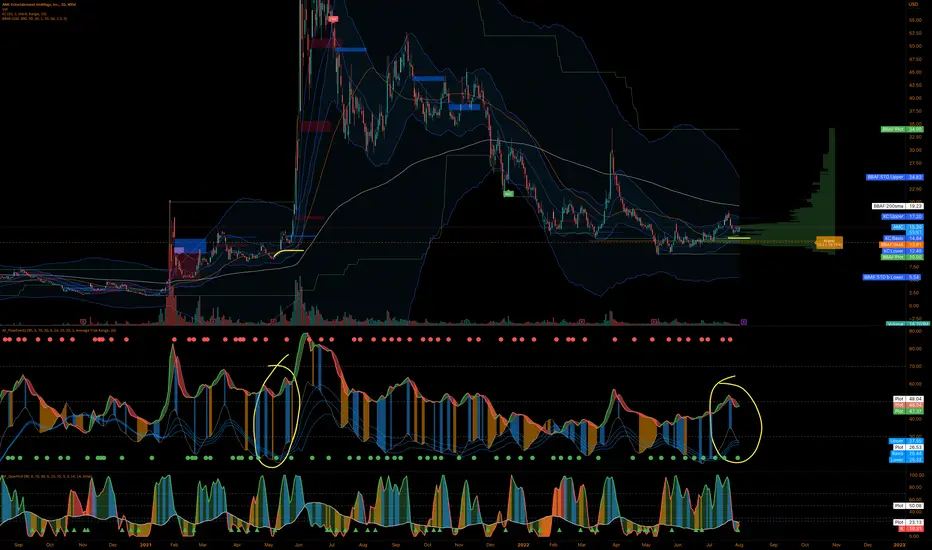
MACD Wedge Pattern on Weekly Chartpotentially awaiting a breakout ( to the moon?) after a good summer
theater season and converging MAs with earnings soon upcoming
as the catalyst.
Fundamentals:
Earnings calls
Upcoming
Q2 2022Scheduled Aug 4
PreviousEPSRevenue
Q1 2022Beat 2.85%Beat 5.69%
Q4 2021Beat 56.55%Beat 5.15%
Q3 2021Beat 19.13%Beat 4.07%
Q2 2021Beat 25.66%Beat 16.38%

To the moon?Maybe it's the time, everything looks like the last time that we see the squeeze. #tothmoon
AMC Long Term Wedge for Breakout with Earnings UpcomingMaybe for a new short squeeze? Apparently heavily shorted. Earnings could surprise given the summer movie season with Top Gun etc.
I am considering a buy-stop order at $14.80 above the high of days July 28 and 29th.

AMC Entertainment Options Ahead Of EarningsLooking at the AMC Entertainment options chain, i would buy the $17 strike price calls with
2022-10-21 expiration date for about
$2.11 premium.
Looking forward to read your opinion about it.

AnalysisOn AMC we can say that there is a balance between buyers and sellers. However, we would have a true uptrend if and only if the vwap indicator as well as the resistance line are forcefully broken by a large green candle and accompanied by large green volume. On the other hand, we would have a downtrend if the vwap and the support line are forcefully broken by a large red candle and followed by large red volume.Thanks.

AMC Squeeze ProjectionNot sure if a 'kite shape' has ever come up in technical analysis but for the sake of meta we can just say diamond. I think we will run sideways until the half point is tested where we will get a breakout to ~100. After that, since it would be at the top of a rising wedge, we would see a slow consolidation to test the extended bottom trend (orange) where we will see a push to another high point where the squeeze should occur (summer 2024).
If we breakdown, then its just wrong and I can see 5 being a bottom. I've been holding since Jan 2021 and plan to sell -if it works out- at 100 where I will wait for the end of the consolidation period where I will re-enter and hold for another year for capital gains (woohoo waiting!!)
Ultimate sell target: $1,000.00
I know this idea is based off the Short Swap theory present throughout meme stock talk. I believe AMC and GME are the most profitable and I believe the short swap theory is true. When the economy crashes, people will look for anything going up. And when the shorts exit, amc and gme will be that ticket to big gains - the initial cause for the squeeze. The top is impossible to chart.. 1k seems reasonable to me.
Good luck

AnalysisHere, uptrend after the breakout with force the resistance line and the vwap indicator by a big candle with a large volume.Thanks.

I‘ll sh*t bricks if this hits the main trendlineAs the title suggests, I don‘t believe the main trendline will be hit. As we know, most gaps need to be filled. So 17$ again soon:)

AMC UpdateSo I bailed a day too early lol, and I think it drops for a few days, but I plan to get back in before earnings.
If anything I'm waiting for $16 before I buy back in.

$AMC cypher Watching 786 on $AMC on a hard drop if it loses 618 here. NQ can flush so please use caution, will update TP's if it trades.

Pray to your Gods for this is not a human matterI expect sideways movements for a day or two. After that we should be seeing 19-21$. If support holds, which I‘m sure it will, we are on our back to 28-32$ range. Everything beyond that is pure speculation. No one knows how high this will go. After extreme pressure from mainstream media trying to shake us off, I believe even more that this will be a once in a lifetime oppurtunity to redirect many of our lives. This is far beyond simple TA. This is far beyond anything we can imagine. In the end, the diamond hands will chose their price since there is no limit on how high a stock price can go. Market cap is an illusion.
Youtubers who have been known as the faces of the Shortsqueeze movements are turning away. Probably paid off to make us sell at 270$ LOL. We didn‘t come this far to sell at brokie numbers. I genuinly believe we will surpass the 270$ prediction by at least a 5 fold. Even if there is no limit, especially with a short squeeze of this magnitude, weak hands will fumble the bag hard by selling too early.
Stay strong. Stay focused. Stay zen.
Ape out.

AMC still going higher!AMC
Short Term
We look to Buy at 14.20 (stop at 12.69)
Broken out of the channel formation to the upside. This is positive for sentiment and the uptrend has potential to return. There is scope for mild selling at the open but losses should be limited. Further upside is expected.
Our profit targets will be 18.64 and 21.01
Resistance: 20.00 / 30.00 / 45.00
Support: 14.00 / 12.17 / 10.35
Disclaimer – Saxo Bank Group. Please be reminded – you alone are responsible for your trading – both gains and losses. There is a very high degree of risk involved in trading. The technical analysis, like any and all indicators, strategies, columns, articles and other features accessible on/though this site (including those from Signal Centre) are for informational purposes only and should not be construed as investment advice by you. Such technical analysis are believed to be obtained from sources believed to be reliable, but not warrant their respective completeness or accuracy, or warrant any results from the use of the information. Your use of the technical analysis, as would also your use of any and all mentioned indicators, strategies, columns, articles and all other features, is entirely at your own risk and it is your sole responsibility to evaluate the accuracy, completeness and usefulness (including suitability) of the information. You should assess the risk of any trade with your financial adviser and make your own independent decision(s) regarding any tradable products which may be the subject matter of the technical analysis or any of the said indicators, strategies, columns, articles and all other features.
Please also be reminded that if despite the above, any of the said technical analysis (or any of the said indicators, strategies, columns, articles and other features accessible on/through this site) is found to be advisory or a recommendation; and not merely informational in nature, the same is in any event provided with the intention of being for general circulation and availability only. As such it is not intended to and does not form part of any offer or recommendation directed at you specifically, or have any regard to the investment objectives, financial situation or needs of yourself or any other specific person. Before committing to a trade or investment therefore, please seek advice from a financial or other professional adviser regarding the suitability of the product for you and (where available) read the relevant product offer/description documents, including the risk disclosures. If you do not wish to seek such financial advice, please still exercise your mind and consider carefully whether the product is suitable for you because you alone remain responsible for your trading – both gains and losses.

Looks messy but I'll take it!Todays red candles were expected after such a green week, hitting some resistance as the price has continuesly shown strenght when the overall market was weak. More bullish than ever on AMC. Price is up almost 90% since may. This will most likely continue with more news from the CEO himself via Twitter with the most recent being the annoucments concerning the debt of the company. More nice moves from the leadership are anticipated!

3 within a 3 wave to look forward to for next week.This is how I think the wave count will unfold for next week. Check out my previous post on AMC showing prequel before this move.

Can AMC continue to grow?If AMC to break 22-24 levels, it'll break out to 72 - 275
Give feedback on my idea

AMC Setting up to test resistance at $20The title says it. We have holding up the daily trendline quite good. Lets go!

Major AMC TrendlineAn extended trendline to rule them all. Drawn from the IPO of #AMC, connected to next low on Feb '16. Note all of the interactions and touches. Crossing it is explosive. See June '21 & March '22 runs.

AMC: Looking bearish...Fibs in green, ascending channel (bear flag), target is 9.42, next would be 7. Channel was copy and pasted below as is the traditional measure for an ascending channel. There is confluence at the EQ and 9.42, as well as with bottom of channel and 7. (Note to self) Continuation patterns happen more often than reversals.

AMC AnalysisI was wrong about the analysis on AMC. Last week, I expected price to go lower to take out the sell-side liquidity. However, price went higher. Target for this upmove could be the equal-highs at 19.01. From here, we could still see price going lower from here. Either that, we can see a start of an uptrend to take out the clean highs at 34.33.

AMC Volatility Incoming Bollinger Bands indicate a splike in volatility in the near future. Will it be to the upside? We will have to wait and see.

AMC - Bullish Wave pattern My technical analysis for AMC and why I am bullish on the stock
Strong support zone between the 15.70$ to 16.10$ area.
Since Jun/22/22, we have been on an up-trend. (Creating higher highs / higher lows)
Waiting for confirmation pullback to support zone
Once the support zone is hit, the next target zone will be the 18.30$ to 19$ area.

Break $72.62 and minimal target is $111If $9.70 is the low now and we can break $72.62 the price targets we can look at are below based off Fibonacci retracements. Fib levels are in brackets
All time high (1) $72.62
Bottomed out (0) $9.70
To validate the price targets below AMC must breakthrough $72.62
In the previous cycle $72.62 was the 4.236 fib extension level taken from its previous cycle top and bottom. So there’s no reason why It can’t reach the 4.236 again.
(1.618) $111.50
(2.618) $174.42
(3.618) $237.34
(4.236) $276.23
I do believe AMC behaves as in a crypto type cycle with bull run tops and bottoms.
If you’re unfamiliar with Fibonacci extensions I highly recommend watching some videos and doing some research on them because they are pretty much the reason prices land where they do.
