AMP approaching resistance, potential drop! AMP is approaching our first resistance at 133.04 (horizontal overlap resistance, 161.8% fiboancci extension, 38.2%, 61.8% fibonacci retracement) where a strong drop might occur below this level to our major support at 118.39 (38.2% fibonacci retracement, horizontal swing low support).
Stochastic (21,5,3) is also approaching resistance and seeing a bearish divergence where we might see a corresponding drop in price.
AMP trade ideas


Long AMP for the next wave higherThis daily chart of AMP shows an ongoing impulsive move higher. Looking for the end of Wave 4 before a move back to the highs in Wave 5. I've highlighted the Elliott Wave principle of "alternation" on the chart, which says that the two corrective waves of an impulsive sequence often alternate in form (i.e., sharp vs. sideways, simple vs. complex). With AMP, Wave 2 was a sideways, prolonged correction. Therefore, we look for a sharper and shorter pullback in Wave 4. Initiating a long position at 140 for a move to 190. A move below 115 will cause me to reevaluate the setup.


AMP Sort OpporunityAn intraday high potential, Back Tested Sort Analysis.
We ll try to find an entry price within the expected pull back zone 177.91 - 179.58 as previously being back tested.
We ll try to enter into the correction of the uptrend movement tracking trend oscillators as below:
ADX slopes down pointing a bearish decline.
CCI diverges the price crossing down the zero level as well as shown in the chart.
DETAILS ON THE CHART
NOTE: Entry range area above the entry point, is calculated upon 80% of the recorded pullback back tested past performances
DISCLAIMER: This is a technical analysis study, not an advice or recommendation to invest money on.


Another wave down to complete wave (4)?looking for another wave down to finish wave (4), possibly near the 38.% or 50% re-tracement level

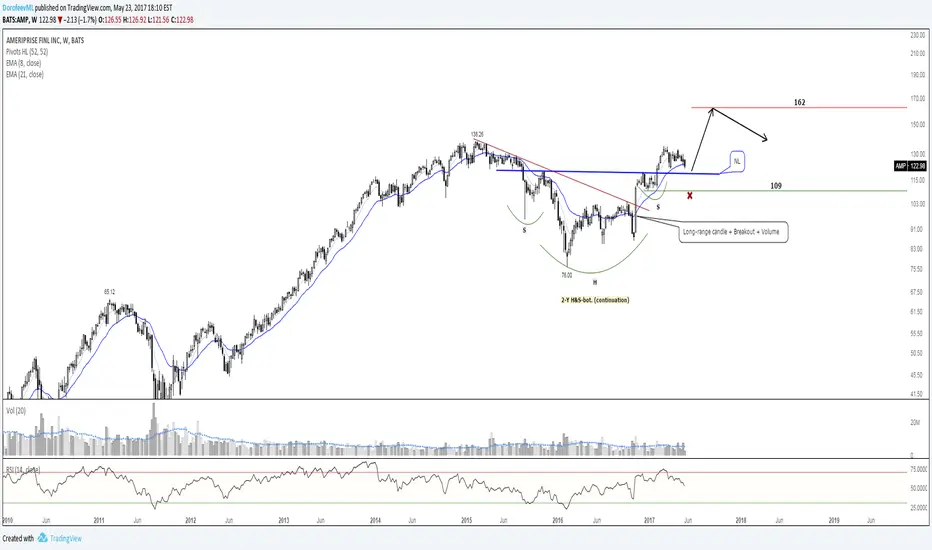
AMP: Another one to consider. Chart looks promising. If went long personally I will use a close < recent high of 118.58 (not bats) as my stop.
Review services such as Credit Suisse, Ford Equity Research, and Market Edge give it a "buy". Would consider target of 160-170. Feedback appreciated.

Possible long opportunityNYSE:AMP has kept its rising trend-line since 2009. More recently, it has formed a base around $112. I am interested to see if this comes back to $100~$104 level, I will be a buyer if it does.


AMPSHORT - 4 to 4 1/2 month time frame, you can even scalp around that 1-2 zig zag level (certainly coinciding with markets next bounce from this selling wave into MA50 weekly). This trade is very good TA wise stoploss previous high.


