AMZN SELL ANALYSIS SMART MONEY CONCEPT Here on Amzn price form a supply around level of 239.69 and is likely to continue falling so trader should go for short with expect profit target of 232.84 and 226.67 . Use money management
AMZN trade ideas

AmznEarnings this week.. long term channel (Yellow)
Mid term channel (White)
In my last Amzn post (See link)
I said Amzn could grind at the top of it's long term channel after a pullback from 230, and it has.. from 218 - 237 and now we are at a crossroads this earnings..
Both scenarios will end in a massive correction but one scenario could give a 7% pop higher before hand .
In this scenario Amzn pops up after earnings and tags the top of secondary channel or 253.. at this 250ish area is where I would open a short positions.. target 230-234.
2nd scenario is the complete Bearish with no move higher
Price pulls back from primary channel and corrects to the 50sma.. if 50 is lost then 200.00 or 200sma is next
Let's see what happens..
Smaller levels
234 support , below 234 and 230 comes ..
20sma is at 228 , I doubt they give that up before earnings

Speculative Madness: The Market’s Bubble Stocks Some stocks areSpeculative Madness: The Market’s Bubble Stocks
Some stocks aren't just overvalued—they're in full speculative bubble mode. Fundamentals? Irrelevant. When euphoria takes over, rationality disappears.
Here’s my list of bubble stocks that scream unsustainable pricing:
SBUX, T, PLTR, BMY, PYPL, NFLX, GS, ISRG, ARM, C, SHOP, BSX, SPOT, UBS, IBKR, RELX, CEG, CRWD, MSTR, MMM, DASH, COF...
And let’s not forget the obvious: TSLA, META, AMZN, AVGO, GOOGL, JPM, MA, V, WMT.
Honestly, the entire banking sector, brokers, and tech are in bubble territory.
What the hell is going on with this market? Why are algos just buying, buying, buying, squeezing all the shorts?! Unbelievable.
The dump will be insannnnnnnne!!! 🚨

AMZN is looking for an uptrendAMZN hits the target of double top. After reaching the target area, it will form a V-shaped bottom, and if it is maintained, it will form two double bottoms, which makes the stock set for an upward trend.

$AMZN 3 Monthly Green close to 100kThis is my CORE holding I am looking for 100k
Plan is to add more on every dip and pull back
Drop a LIKE and I will alert here!

$AMZN long to $260 measured move targetThis is a daily of AMZN. It shows an initial move into the bull flag, a breakout-pullback, and an expected measured move to a TP of $160/share. Time period 3-6 months. Best of luck and good trading.-Mr Joseph

Amazon's Tight Consolidation! Is AMZN Ready for a Breakout?Technical Analysis
Price Action Overview:
* Trend: AMZN is currently in a consolidation phase, forming a tightening symmetrical triangle pattern. This suggests a potential breakout, either upward or downward, depending on volume and market sentiment.
* Key Levels:
* Resistance: $241.78 (previous high) and $250 (gamma wall and psychological resistance).
* Support: $232.50 (gamma put support) and $218.93 (recent low).
Indicators:
* MACD: Slightly bearish divergence; momentum is fading, but it remains above the signal line.
* Stochastic RSI: Approaching overbought levels, indicating potential short-term resistance or consolidation.
Trading Plan
1. Bullish Scenario:
* Break above $241.78 with increased volume. Target $250 and $255.
* Entry: $242.
* Stop-Loss: $239.
* Profit Target: $250.
2. Bearish Scenario:
* Break below $232.50 with volume confirmation. Target $225 and $218.
* Entry: $232.
* Stop-Loss: $235.
* Profit Target: $225.
Options Strategy
1. Bullish:
* Call Option: Buy $245 Call (Expiration: 2/16/2025).
* Target: $250.
* Max Risk: Premium paid.
2. Bearish:
* Put Option: Buy $230 Put (Expiration: 2/16/2025).
* Target: $225.
* Max Risk: Premium paid.
GEX Analysis
* Positive Gamma: Strong resistance at $250, aligning with the highest positive NETGEX zone.
* Negative Gamma: Support at $232.50. A break below this level could trigger rapid price declines.
Conclusion and Directional Thoughts
AMZN is tightly coiled, and the direction will depend on whether it breaks the resistance at $241.78 or support at $232.50. With the current technical and gamma setup, a breakout is imminent. Bulls should watch for volume spikes above resistance, while bears should monitor breakdowns below key support.
Disclaimer
This analysis is for educational purposes only and does not constitute financial advice. Prices and market conditions can change; always manage risk and verify conditions before trading. PM for questions or detailed insights.

AMZN potential SHORTRSI has lost upward momentum
MACD has begin a path to crossing, the same for RSI.
FIB is showing resistance at 0.786 ($231.61)
Downward momentum to 0.618, if price falls below 0.786 FIB level and holds.
This is not financial advice.

Amazon: Volatile!The Amazon stock has shown significant volatility recently but managed to recover its temporary losses of over 7% just as quickly. We still position the stock within the turquoise wave 3, which should have additional upside potential. Once this high is established—something that may have already occurred—we anticipate a wave 4 pullback before wave 5 completes the larger magenta wave (3) further to the upside. As you can see in the daily chart, this magenta wave (3) acts as a subwave of the green wave , which in turn should lead to the peak of the even larger beige wave III. Following this, we expect a more pronounced wave IV correction before another round of impulsive rallies drives the stock to new highs.

1/29/25 - $amzn - ST buying into $meta print1/29/25 :: VROCKSTAR :: NASDAQ:AMZN
ST buying into NASDAQ:META print
- i'm going to leave aside valuation at the moment, but to say: NASDAQ:AMZN is not cheap, it's not expensive and in a 1-day context, that doesn't matter
- went on a walk after resetting my feet taking some profits on NASDAQ:NXT today (the ST stuff - don't worry fam i still have a warchest of ITM leaps)... and some things occurred to me related to tonight's NASDAQ:MSFT , NASDAQ:META , NASDAQ:TSLA prints
1/ none of these companies are going to communicate taking down capex guidance for a few reasons. A) given what just happened this weekend, companies this BIG and LT-thinking need to communicate and act consistently and thoughtfully. perhaps in time, this will be the case, but they won't like say this (they don't even know), and in fact they're incentive is NOT to - which is point B) if say NASDAQ:META says they are taking down capex, but NASDAQ:MSFT isn't... then we're still at the phase where someone is likely seeing something the other isn't - and both will be "wrong" - prisoner's dilemma. furthermore, if you DO plan on taking capex guide down bc you see reason to do this - you would try to convince your "competition" to keep spend high and "waste" this amt such that they haven't figured out what you have AND they're less likely to try and figure out what you have such that you don't say take down capex guide.
as u guys know i write my stream of thought... no edits... it's for me, but if it benefits you, great! so hopefully the above makes sense, and if not we can hash out rest in comments.
SO! the conclusion here is, that if chip stocks/ e.g. NASDAQ:NVDA (and let's even throw NASDAQ:AAPL in there now, NASDAQ:GOOGL too) are looking for some confirmation even if it's incomplete about capex spend... the result will be net +ve $nvda... and hence, the marginal flows back into biggest stock, into ETFs/passive flows... into Q's... resumes.
...and drum roll... NASDAQ:AMZN is big and benefits flows. The 1/31 $140 calls are cheap b/c earnings IV isn't embedded this week :)
BUT WHAT ELSE IS GOING ON, why NASDAQ:AMZN for a second, unrelated reason?
- we've seen the consumer IS spending. while they might be virtually bankrupt (not everyone, but lots), credit IS flowing... airlines are crushing, black friday was huge this year, stonks had a good year (wealth effect +ve), the new admin in the US is jobs friendly, people are still riding high as a kite.
- so such that NASDAQ:META says "our ad biz is crushing" partially to their own AI efforts (respect!) but also bc incrementally there's more volume bc of consumer... that will translate into NASDAQ:AMZN beat, and the algos will arb this immediately tn.
- so while i have a smally flyer on NASDAQ:META into the print (i think they beat, but it's not a big position, just playing the game), i think an equally interesting bet here are ST near the money but still OTM c's on $amzn.
let's see. the setup looks interesting and it might be a 60/40, so keeping size small, but i try to take all bets where i think i could have a small edge and size/ risk manage accordingly.
V

AMAZON - preparation for the Christmas Rally?Hi , dear traders we are watching how Amazon has formulated a very strong assending channel, currently their financials have been doing amazing and we are approaching the Christmas Rally and the finalization of the Q4 earnings. Their recent announcment that they would do heavy investing in AI would be extremely beneficial for the company and sould conclude the continuation of their bullrun.
Entry at 201$
Target 235$

$AMZN LONG after bull flag...This is a weekly of AMZN. I see a bull flag which had a breakout, a pullback, then so far a bullish engulfing weekly candle has been forming. Adding.

AMZN: Resistance Test at $240 – Breakout or Rejection?🔥 LucanInvestor's Strategy:
🩸 Short: Below $235, targeting $225. If EMA 9 fails to hold, downside pressure may accelerate.
🩸 Long: Above $240, targeting $260. A strong breakout could confirm bullish continuation.
🔥 LucanInvestor's Commands:
🩸 Resistance: $240 — A key level that needs to be broken for upside momentum.
🩸 Support: $225 — EMA 200 aligns as a crucial trend support.
Amazon has built strong momentum, bouncing off key support levels, but now faces a major test at resistance. MACD is signaling strength, but confirmation is key.
👑 "The market doesn’t wait—position yourself before the move."

AMZN RESPECTING THE EMA 50?long from 220.52.
Trailing stop: 8%-10%.
Adding will occur if the 50 EMA is respected and the company's outlook is somewhat bullish as well.
Earnings are at the end of the month.

Amazon Reaches New All-Time High: Should You Buy Now...?AMAZON has successfully surpassed its previous all-time high and has maintained a position above this critical level. This upward momentum presents an opportunity for traders to consider entering a long position on a pullback. A strategic entry point for this trade could be set at $235.50, where we can potentially capitalize on a rebound as the stock stabilizes. It's essential to monitor volume and market sentiment during this pullback to ensure a favorable risk-to-reward ratio for the trade.

AMZN Technical Analysis for Trading and GEX Option. Jan . 28Technical Analysis (TA):
* Trend: AMZN has shown a strong recovery from its prior dip, breaking above the downward resistance line. The recent upward momentum has pushed the price closer to the key resistance zone of $236.40.
* MACD: Positive crossover indicates potential upward momentum continuation, but histogram strength shows signs of plateauing.
* Stoch RSI: Overbought at 96.94, suggesting the potential for a pullback or consolidation in the near term.
Key Levels:
* Resistance:
* $236.40: Recent swing high and breakout level to monitor.
* $240.00: Psychological and potential gamma resistance area.
* Support:
* $227.50: First support level near consolidation prior to breakout.
* $222.50: Stronger support aligning with prior accumulation.
* $192.50: HVL and key put support zone.
GEX Analysis:
* Gamma Levels:
* Highest Positive NETGEX: $236. This level is acting as a strong resistance zone.
* Gamma Walls:
* 2nd CALL Wall: $240.
* 2nd PUT Wall: $222.50, highlighting strong put protection below.
* Highest PUT Support: $192.50.
* Options Sentiment:
* Implied Volatility (IVR): 62.8 (high, signaling caution for option buyers).
* Call-to-Put Ratio: Skewed bullish with Calls at 16.6% dominance.
Scenarios:
1. Bullish:
* Entry: Above $237 (confirmed breakout).
* Target: $240-$245.
* Stop-Loss: Below $233 to protect against false breakouts.
2. Bearish:
* Entry: Below $227.
* Target: $222.50-$220.
* Stop-Loss: Above $230.
Action Plan:
Monitor the $236.40 breakout or rejection closely. The IV levels suggest attractive premium selling opportunities, especially with resistance-heavy zones.
Disclaimer:
This analysis is for educational purposes only and does not constitute financial advice. Always perform your due diligence before trading.


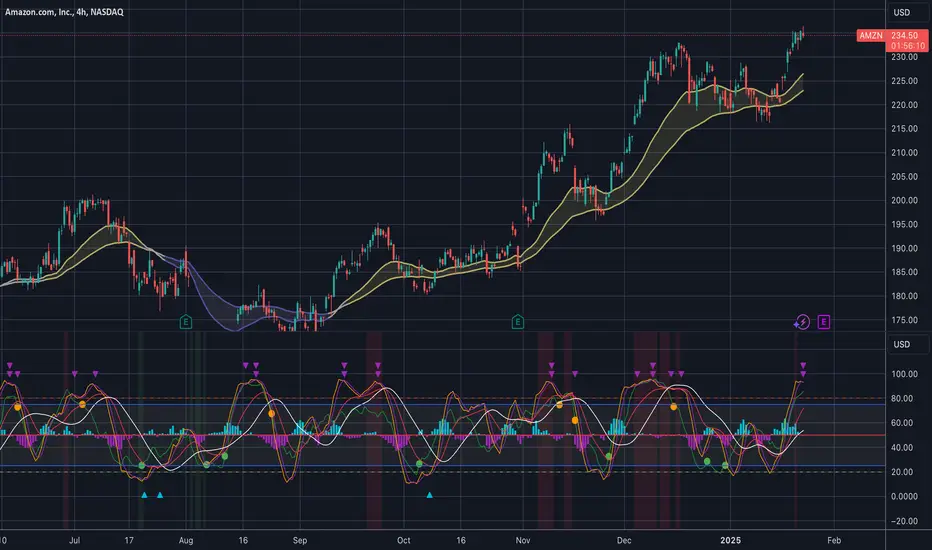
AMAZON going for a DIP on the 4HCrystal ball has spoken, AMZN is due for a small DIP.
Trend Analysis:
• The price is trading in an overall uptrend, respecting the 50 EMA (yellow) and 20 EMA (gold), indicating strong bullish momentum.
• Recent price action has formed higher highs and higher lows, maintaining bullish structure.
JP StochDemark Indicator Insights:
• The indicator is approaching overbought levels, currently crossing above the 80 threshold, which signals potential exhaustion in the short term.
• Bearish divergence is forming as price makes new highs while the indicator fails to confirm.
• Previous occurrences of such setups led to short-term pullbacks before continuation.
Support & Resistance Levels:
• Immediate resistance at $236-$238, aligning with recent highs.
• Short-term support at $ 225 , where moving averages align.
• Strong demand zone around $210-$215, coinciding with prior consolidation.
Trade Signal & Probability:
Bullish Bias : Continuation likely if price sustains above $ 230 with momentum confirmation.
Bearish Pullback : A corrective dip to the $225 zone is probable if momentum weakens.
Target Levels : Upside targets at $240 (psychological resistance) and $250 if momentum persists.
Risk Levels : Watch for breakdown below $225, which could trigger further downside to $215.
Conclusion :
Momentum remains bullish but overbought signals suggest caution.
Monitor for a healthy retracement before continuation. A break above $238 could confirm further bullish momentum.
Like the analysis? Follow, Subscribe for more...
$AMZN - pre earnings break outAMZN - Stock continues to move higher after breaking out of the channel. Stock still strong on charts as long as $235 holds. watching for $240 AND $250 next levels of resistance. if fails to hold we can see a retest of $230 and $225. Stock is strong on indicators with earnings end of the month. possible pre earnings run

Elliott Wave View: Amazon (AMZN) Impulsive Rally in ProgressShort Term Elliott Wave View in Amazon (AMZN) suggests rally to 233 on 12.16..2024 ended wave ((3)). The stock then pullback in wave ((4)) which unfolded as a double three Elliott Wave structure. Down from wave ((3)), wave (W) ended at 218.35 and wave (X) bounce ended at 230. Wave (Y) lower ended at 215.57 which completed wave ((4)) as the 30 minutes chart below shows.
The stock has resumed higher in wave ((5)). It has managed to break above wave ((3)) at 233 and made all-time high. This confirms the next leg higher has started and opens up short term bullish sequence. Up from wave ((4)), wave (i) ended at 221.82 and wave (ii) ended at 216.2. Wave (iii) higher ended at 223.44 and wave (iv) ended at 220.75. Final leg wave (v) ended at 225.31 which completed wave ((i))
The stock then corrected in wave ((ii)) at 220.01. The stock has resumed higher and soon should complete wave ((iii)). It will then pullback in wave ((iv)) before turning higher again in wave ((v)) to end wave 1. Near term, as far as pivot at 215.57 low stays intact, expect pullback to find support in 3, 7, 11 swing for more upside.

Interesting Simetry in $AMZNStarting from the 5th of August 2024 every time NASDAQ:AMZN reaches an important Fibonacci level retraces around 7%, then moves higher.
Once it reached 0.618, the Fibonacci level corrected by 6.86% in 5 days and then moved higher.
We have another wave up followed by another correction this time 7.62% in 9 days.
And again another wave up followed by a correction of 7.51% in 10 days to Fibonacci level 1
Once it reached 1.618 Fib level retraced to 1.382 Fib level Correcting 7.24% in 18 days this time.

Bullish continuation? NASDAQ:AMZN is looking at a continuation of uptrend after a strong bullish break out of the flag formation. Breakout was relatively healthy as there isn't any parabolic break. We expect prices to continue its strong momentum and break above the key resistance at 233.70.
Long-term MACD remain strong and healthy. Stochastic Oscillator though confirmed the overbought signal earlier on, but selling pressure remain weak based on price action and the %K and % D line may performed a positive crossover soon. 23-period ROC is back above the zero line and confirming the rising momentum. Volume is relatively healthy.

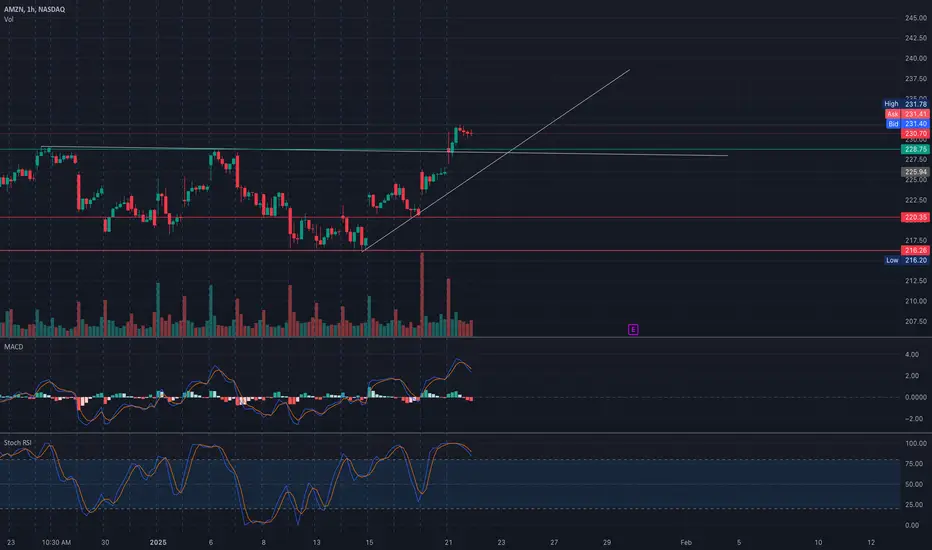
AMZN Approaching Key Levels! Critical Moves Ahead - Jan 22Technical Analysis for Trading
* Trend Overview: AMZN continues its bullish trend, supported by a rising trendline. The price is consolidating near $231.40, testing immediate resistance. Momentum shows strength, but overbought conditions may trigger a short-term pullback.
* Key Levels:
* Resistance: $231.40 (current level) and $235.00 are critical zones for a breakout.
* Support: $228.75 and $225.94 are key levels to watch in case of a retracement.
* Indicators:
* MACD: Bullish, but momentum is tapering off, signaling potential consolidation.
* Stoch RSI: Overbought, which may lead to short-term profit-taking.
* Volume: Consistent buying interest supports the upward move. Any breakout must be confirmed by higher volume.
Gamma Exposure (GEX) Insights for Options Trading
* Key Gamma Levels:
* Positive GEX: $235.00 is the strongest resistance level, where the highest call wall resides.
* Negative GEX: $220.00 and $217.50 are critical put support zones.
* Options Metrics:
* IVR: At 52.4, options premiums are moderately high, offering opportunities for credit strategies.
* Call/Put Skew: Calls dominate at 23.6%, reflecting a bullish market sentiment.
* Actionable Gamma Zones:
* Bullish Scenario: A breakout above $231.40 could lead to rapid testing of $235.00 due to gamma-driven buying pressure.
* Bearish Scenario: A pullback below $228.75 might activate put support at $225.94.
Trade Scenarios
1. Bullish Setup:
* Entry: Break and hold above $231.40.
* Target: $235.00 and $237.50.
* Stop-Loss: Below $230.00.
2. Bearish Setup:
* Entry: Break below $228.75.
* Target: $225.94 and $220.00.
* Stop-Loss: Above $230.00.
Important Note
The market may experience volatility around key levels. Reassess price action during pre-market or intraday activity and adjust your strategy accordingly.
If you have questions or need analysis for another stock, feel free to reach out!
Disclaimer: This analysis is for educational purposes only and does not constitute financial advice. Always trade responsibly.