Amazon - Massive Resistance AheadHello Traders, welcome to today's analysis of Amazon.
--------
Explanation of my video analysis:
With the quite obvious and expected channel breakout in 2016, we saw a rally of more than 500% towards the upside on Amazon. This pump was followed by a retracement back to a previous support level before we saw another bullish reversal. If Amazon breaks back above the structure mentioned in the analysis, market behaviour is bullish and I will be looking for longs.
--------
I will only take a trade if all the rules of my strategy are satisfied.
Let me know in the comment section below if you have any questions.
Keep your long term vision.
AMZN trade ideas

The fifth wave with expansion! Corrective patternDear FRIEND,
I hope you're doing well and that the new year has started on a good note for you. I wish you success in your business endeavors and a happy new year with your loved ones.
As someone interested in the Elliott Wave principle, I find it to be a valuable tool for market analysis. I have developed my approach by combining this principle with my personal experience and by considering various scenarios that are likely to occur in the market.
I am sharing my analysis with you. However, please note that I am not providing any buy or sell signals. My goal is to share my unbiased analysis with you so that you can use it as a guide to make informed decisions.
In the attachment, I have included my previous analysis of the same market so that you can compare and see the. All the details of my analysis are clearly labeled, making it easy for you to understand (although having a basic familiarity with the Elliott Wave Principle theory will help you understand the analytical idea more easily).
I have been studying the Elliott Wave principle for almost three years now. With time, my understanding of this knowledge and experience has increased. What I have achieved so far is a legacy of a genius named Ralph Nelson Elliott, and I am truly satisfied with my progress. May his soul rest in peace and his memory be cherished.
Thank you for your support so far. I am grateful and will always remember your kindness. Please feel free to share your thoughts and feedback with me.
I hope my analysis will be useful to you in your business journey, and I wish you all the best.
Sincerely,
(Mr. Nobody)

amzn looks very bearish todayamazon looks bearish below my moving averages in the pre market gapping down.

AMZN UpdateWe have almost hit the 1.618 extension @ $158.94 which is a very common end point for this type of move. This last high that we made has been on negative divergence and implies we should be headed lower soon. Structure also says we have topped or will soon. Rather we are topping in our primary B wave or hitting a wave 1 top, the next big move points down. If we are still in fact in wave IV, our next drop down should be powerful as it will be primary wave C. MACD supports this count, but as you can see by the ALT, this could be just the beginning of our larger wave V. The structure of our next move will hopefully clear up the picture of the larger count. The market as a whole is in a very precarious position and it would be wise for traders to be skeptical, and use stops to protect their assets. I have said it many times recently, we are on the verge of topping in the US indices and the type of price action that is to come will be some of the hardest charts to trade you will ever see in our lifetimes. This is no longer your fathers or even grandfathers stock market, but your fathers fathers fathers market of the great depression. The indices SS II was very deep and quick. That means the SS IV coming up will be "shallow" and long. I put shallow in quotations because I still expect a 40-50% decline from where prices are now before it comes to an end. The next question one reading this should ask, How will that affect Amazon?
Friendly Reminder: Beginning March 1st (~7 weeks), I will be dramatically changing my posting schedule here on trading view.

✅AMAZON WILL GO UP|LONG🚀
✅AMAZON is trading in an
Uptrend and the stock broke
The key level of 144$
Which is now a support
Then retested it and is
Now going up again
So I think that we
Will see a further move up
LONG🚀
✅Like and subscribe to never miss a new idea!✅

April 28th Amazon takes a nosediveThis is beyond exaggeration of what will actually happen and it's meant to be funny. I honestly think it's hilarious. I've known for a couple years now that Amazon has been spending way more than it's making. Promoting and talking to investors on stock splits. Closing Book stores and so many problems with their new automated store. Amazon's technology and service centers is a joke and all the customer support agents work from remote locations. Raising their wages was just a publicity stunt to try to manipulate shareholders to buy more. Desperate and failing. On top of all this they're building a new headquarters that cost 2.6 billion dollars to flash and market a fancy building like nothing is wrong with the company. Ha what a scam

I was wrong... Market trends have been extended by a factor of 4The meaning behind factor of 4.
Market flow has slowed down significantly after the long bullish cycle.
The highlighted purple areas was during a struggling time in the markets.
The market performance currently is struggling massively to hold
as manipulation to gather investor attention after the stock split failed.
Just because a stock split and the price looks much cheaper it doesn't
change the fact that this market is struggling. The inflow in this market
is barely enough to cover the sellers in the market. The big seller is
Jeff Bezos and if Amazon is buying back shares to maintain market structure
with investors exiting on a quarterly timeline that is the factor of 4 structure.
The market is moving 4 x slower with less volatility holding an overbought
market. Amazon is using profits to keep its value and growth expectations
is bearish. In time this realization will start to take shape and i predict a
market price of 9.09 within 7 years. Manipulation is attracting investors
to buy the market as Bezos and other wealthy investors are selling out
over a slower timeline. It is a classic bait and trap market. I sold the top before the
stock split even happened. I saw the signs early enough to make sound judgement.
Be careful with you future retirement and savings accounts. This market
is manipulated with fraud and traded within the laws set by the SEC. That should
say something. SEC approved 11 bitcoin ETF's after Bitcoin already had
its mega billion percent bull market. Bitcoin value will drop significantly
and could soon be worth as little as 1000 to 4000 dollars. There is a lot of fraud
manipulation going on in every market so these wealthy people can sell out on
the complacent traders investing in worthless investments.


Can go low enoughAccording to the pattern, the butterfly cuts out a deplorable picture. The reduction can be up to $50

This Could be the VERY TOP for AmazonI'm getting feelings around the things are about to hit the fan and Amazon might have topped longterm. RSI hit a major resistance, bear divergence, largest FED fund sale ever yesterday, things are just lining up for me, this will get NUTTY if true. Hard to fade this trend of course but a lot of things are lining up for me.

AMZN in a bullish trend @ Daily TF
Story: Printing Bullish Trend and a bullish ascending channel
Anticipation: Can continue making new HH HL since no reversal pattern or divergence
Plan: Buy Limit at .7 Fibonacci level of last HH while riding Dow's Trend

AMZN upAbove the current resistance at 155 - up again. Looking at the futures and the overall market, it can happen today.
Like my yesterdays call,MSFT, can go right at the market opening.

AMAZON Swing Long! Buy!
Hello,Traders!
AMAZON was retesting a
Horizontal support level
Of 143.5$ while trading
In an uptrend and now we
Are already seeing a
Bullish rebound so I think
That we will see a
Further move up
Buy!
Like, comment and subscribe to help us grow!
Check out other forecasts below too!

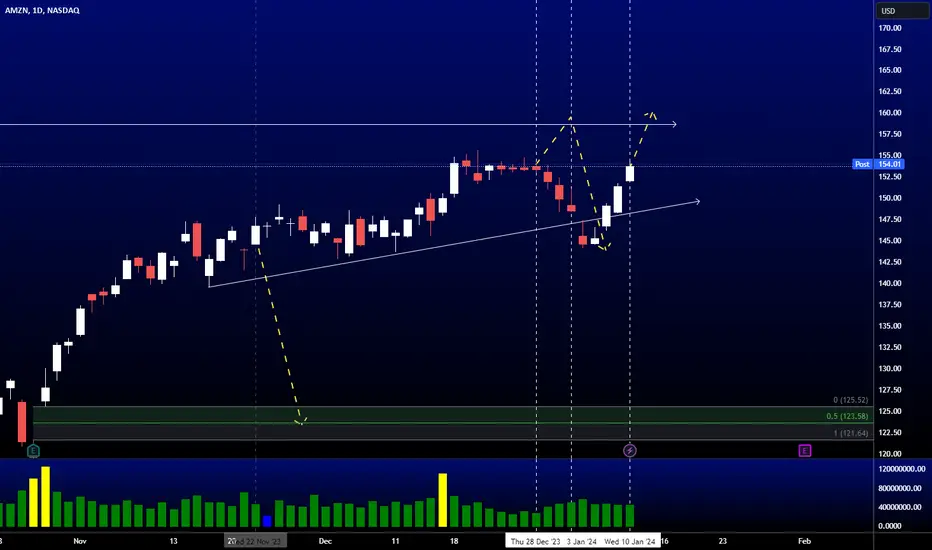
AMZN AnalysisPrice played out nicely as analyzed last week, taking out the sell-side liquidity and make a nice bullish move of +5.19% from there. Right now, I'm expecting price to continue higher, targeting the clean highs at 158.65 next.

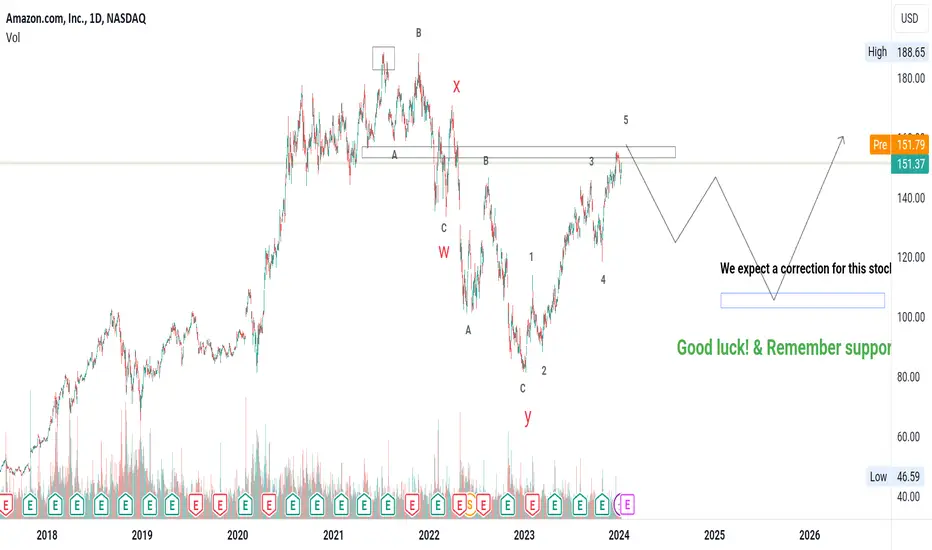
AMAZON NEW UPTREND Amazon complete double zigzag and create 12345. Now we expect a correction for new UPTREND
Swing Trade Ideas Hi folks, These are the trades that I have the most conviction on them. I'm long all of them, will hold them till year end. lets see how will they go.
Not a financial advice do your own research.
Pump the ideas with your likes
Thank you

Amazon Soaring: Unveiling the AI-Powered Path to Prosperity
The recent surge in Amazon's stock, propelling its founder Jeff Bezos to a staggering $3.8 billion gain in just 24 hours, reflects not only the resilience of the e-commerce giant but also the growing investor confidence in its 2024 outlook.
Market Resilience Amidst Tech Turbulence:
Despite facing headwinds alongside other major tech firms during last week's market downturn, Amazon demonstrated remarkable resilience, boasting a 2.60% increase in its shares in Todays trading session. This resilience is attributed to the optimistic outlook on Amazon's profit prospects, particularly fueled by advancements in artificial intelligence (AI).
The Power of AI Investments:
Amazon's strategic investments made during the pandemic are proving to be a catalyst for its current success. The company's commitment to AI development is paying off, with advancements in technology contributing to robust growth trends and improved profit margins. As the world becomes increasingly digitized, Amazon's proactive stance in harnessing the potential of AI positions it at the forefront of the e-commerce and technology sectors.
Cloud Business Boom:
A noteworthy factor contributing to Amazon's positive momentum is the anticipated increase in demand for its cloud business, driven by AI advancements. As businesses across the globe recognize the transformative power of AI, Amazon is well-positioned to capitalize on this trend. The company's cloud services, bolstered by AI capabilities, are expected to play a pivotal role in meeting the evolving needs of industries ranging from healthcare to finance.
Jeff Bezos: The Top Gainer:
The $3.8 billion boost in Jeff Bezos' net worth not only solidifies his status as one of the world's wealthiest individuals but also highlights his unwavering commitment to Amazon's success. Bezos, as the visionary founder, continues to steer the company toward new heights, leveraging AI and other cutting-edge technologies to secure its dominant position in the market.
Technical Analysis: A Bullish Outlook:
A closer look at Amazon's technical analysis reveals a strong development within a rising trend channel in the medium long term. This signals increasing optimism among investors and indicates a continued rise in the stock's value. The breakthrough of resistance at $145 reinforces the bullish sentiment, predicting a further ascent in the near future.
Conclusion:
Amazon's recent stock surge, coupled with Jeff Bezos' substantial gains, underscores the company's ability to weather market uncertainties and emerge stronger. As AI continues to shape the future of technology and business, Amazon's strategic investments and forward-thinking approach position it as a beacon of success in the e-commerce and cloud computing arenas. Investors and industry enthusiasts alike are eagerly watching as Amazon navigates the evolving landscape, driven by the promise of AI-powered prosperity.

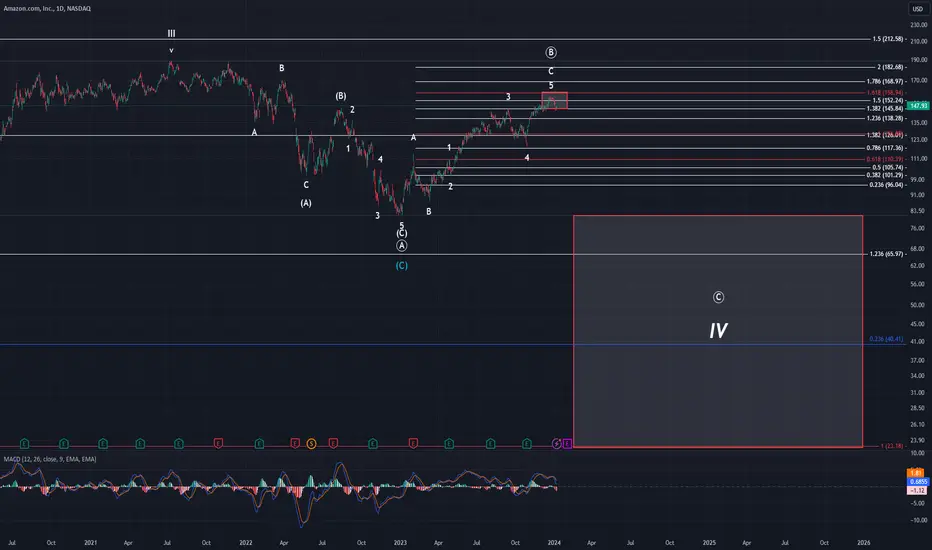
AMZN Update: Big drop incomingIn all the different tech stocks I have been looking at, most of them appear due for a steep correction. This coincides with my thesis for the various US indices too. Looking at this chart Amazon looks like it needs OMH into the 1.618 @ $158.94 to complete wave ((B)) but that is not required. If you are long this thing you are taking huge undue risks for breadcrumbs IMHO. I personally haven't been trading AMZN, but if I was, I would remain flat until we get that next high (if it comes) and be ready to buy puts/short the stock.
The next drop forecasting should take us sub $80 at the least. After that, price should soar to all time new highs, but we are a long way off from that. As you see, I have an ALT count on the chart (turquoise label) per the usual. This count suggests wave IV is already over and we're headed to all time new high in this current move higher. With the state of the economy, the limited benefit AMZN offers (convenience only), and the structure thus far carved out, I think this is not very likely. If you know me though, you know I try to track at least two different counts. Amazon is HIGHLY dependent on the supply chain as they are essentially just a middleman. This makes them especially vulnerable to outside factors that are out of their control. The global unrest/geopolitical environment is not good for Amazon and make it a very risky long-term investment if you ask me. Just my two cents as everyone's responsible for their own decisions. Good luck whatever you decide to do with this information.
Unveiling the Forces Behind $AMZN's 81% Gain in 2023
Amazon (NASDAQ: NASDAQ:AMZN ) quietly emerged as one of the standout performers, recording an impressive 81% gain in its stock value. While the spotlight was often on other tech giants like Nvidia and the AI sector's newfound fascination, Amazon's remarkable turnaround marked one of its best years on record, adding approximately $700 billion in market value.
I. Riding the Tech Stock Wave:
Amazon's surge in 2023 was not isolated but part of a broader trend in the tech industry. The Nasdaq Composite soared 43%, and the Nasdaq 100 experienced a 54% jump, reflecting the overall bullish sentiment in the sector. The "Magnificent Seven," the seven most valuable tech stocks, witnessed substantial gains, positioning Amazon right in the middle of this impressive cohort.
II. Strategic Moves and Profitability Surge:
A pivotal factor contributing to Amazon's success in 2023 was CEO Andy Jassy's strategic approach to enhance profitability. The company underwent its most extensive layoff ever, shedding around 27,000 corporate employees, and divesting experimental ventures like the Scout home delivery robot and the Amazon Care healthcare service. Additionally, several Amazon Go stores employing the "Just Walk Out" technology were closed.
These decisive actions, coupled with sustained growth in high-margin businesses like the third-party marketplace, advertising, and Amazon Web Services (AWS), led to a remarkable surge in operating margin. In the third quarter alone, operating income catapulted from $2.5 billion in the previous year to an impressive $11.2 billion. The cumulative operating income for the first three quarters of 2023 reached $23.7 billion, compared to $11.2 billion in 2022.
III. Continued Focus on Profitability:
Looking ahead to 2024, Amazon's focus on profitability remains a core strategy. Jassy's commitment to leveraging earlier investments, such as incorporating advertisements into Prime Video, signals a continued drive to boost the company's profit margins. While Amazon's current price-to-earnings ratio of 75 might seem steep by conventional metrics, the sustained potential for margin expansion justifies the valuation.
IV. AI and Future Growth:
Artificial Intelligence (AI) emerges as a pivotal growth opportunity for Amazon in 2024. The launch of the Bedrock AI hosting service and a strategic partnership with Anthropic AI, backed by a $4 billion investment, showcase Amazon's commitment to advancing in the AI landscape. Although a breakthrough in AI is not essential for continued success, it could undoubtedly amplify Amazon's growth trajectory. With competitive advantages in e-commerce and AWS, Amazon is well-positioned to thrive in the evolving tech landscape.
Conclusion:
While replicating an 81% jump in 2024 may be unlikely, Amazon's trajectory points to sustained growth. With a wide economic moat, the company has ample room to drive profits higher, supported by strategic moves, expanding margins, and an increasing focus on AI. Investors should keep a keen eye on Amazon in 2024, as the tech giant continues to navigate the ever-evolving landscape with resilience and innovation.

Good long term buy area for Amazon Firstly I should say I am currently very bearish on the macro and expecting lower levels before bouncing next year...
However, I cannot ignore this POC level on Amazon, a lot of volume traded around here in the past, so a good chance amazon may at least hold stronger than the rest of the market if we do see more downside. Hence I am taking this as a long to hedge against some short exposure I have in the market.

AMAZON Seasonals.Amazon Seasonals have been Analyzed; from 2014 to 2023. Bullish Month is marked with Green vertical line and Bearish with Red vertical Line.

AMZN up again. Similar target $152I'm kind of getting guided with AMZN in my face a bit. So I have to buy it this morning and look for it to go up to that $152 area. Last time it was saying $150, so that helps suggest it's actually gonna get there. I'm hopeful this occurs by next Friday.
I have today as a reversal day up in indexes, so that could help.
