CHINA: LONG-TERM SUPPORT BECOMES RESISTANCEA Long-term Symmetrical Triangle has influenced Chinese stock prices for decades. Breakouts have shown predictable price moves. We are now seeing the first Breakdown.
- 10-Year Support became Resistance earlier this year.
- A lower, parallel, 5-Year Support has broken down and looks to become Resi
Key stats
About DBX ETF TRUST XTRACKERS HARVST CSI 300 A SHARES ETF
Home page
Inception date
Nov 6, 2013
Structure
Open-Ended Fund
Dividend treatment
Distributes
Distribution tax treatment
Qualified dividends
Income tax type
Capital Gains
Max ST capital gains rate
39.60%
Max LT capital gains rate
20.00%
Primary advisor
DBX Advisors LLC
Distributor
ALPS Distributors, Inc.
ASHR was the first US-listed China ETF capable of accessing the China A-share market directly. The fund is able to hold A-shares in the Shanghai and Shenzhen Stock Exchanges through the subadvisor, Harvest Global Investments, which has an RQFII license up to a specific quota. If the quota is reached, the index will have to either get its quota increased, use derivatives to maintain exposure, or limit or halt creations, so monitoring is warranted. The fund’s focus on mainland A-shares also gives it a large-cap tilt and a heavy bias toward financials. The RQFII quota can make creations difficult. The index is reviewed semi-annually.
Classification
What's in the fund
Exposure type
Finance
Producer Manufacturing
Electronic Technology
Stock breakdown by region
Top 10 holdings

A good time to get exposed to the China market Read more about this ETF here
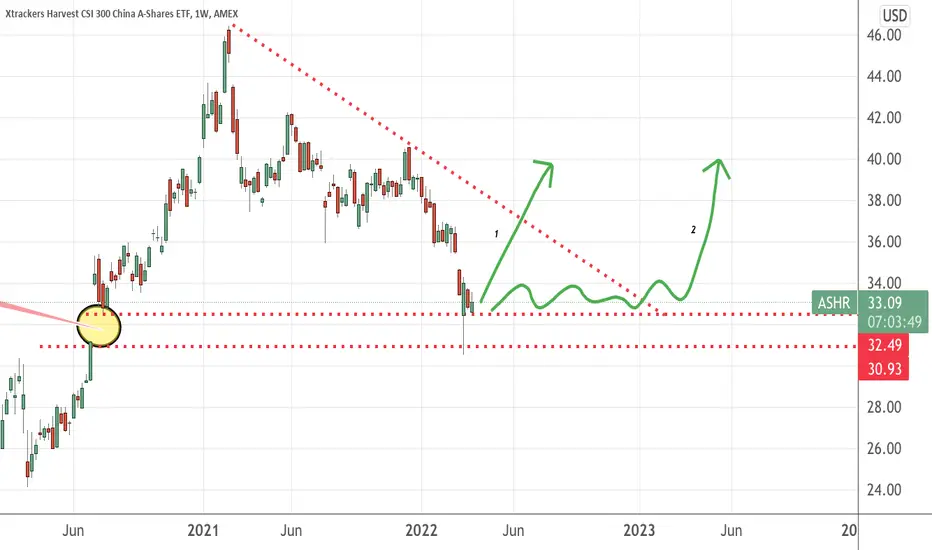
Take a look at the gap being filled and I expect the price to be consolidating for a while more , probably Q3 onwards, we can see some rally ahead.
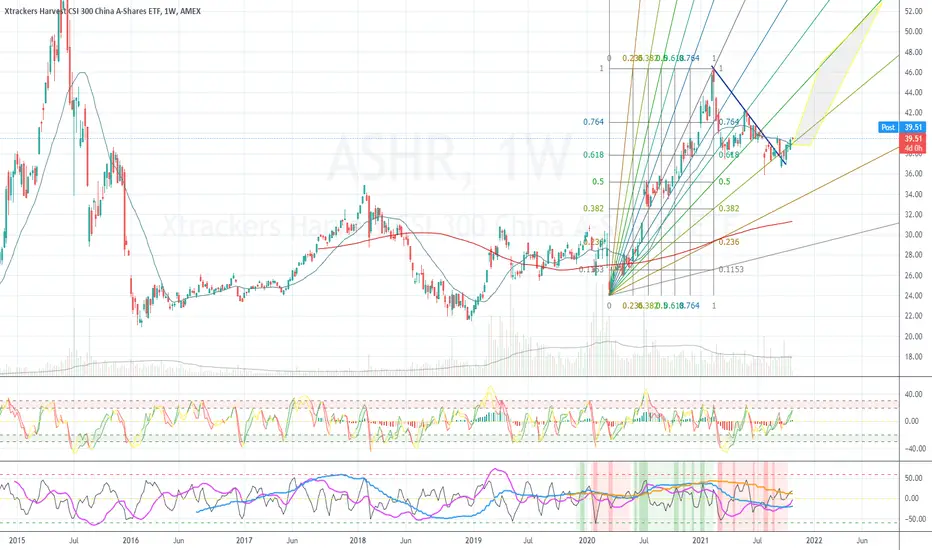
Chinese SSE300 Index ETF: Bearish Dragon with 1.618 TargetThis is an extension to the Bearish SSE50 setup that I posted not so long ago; I found a tradable US Listed ETF that tracks the movement of the SSE300 and the situation on this chart is pretty much the same as the one for the SSE50 where we are breaking a logarithmic trendline, the moving averages,

ASHR (also EEM, CQQQ, MCHI) Longer Term BullishI bought ASHR, but all these Chinese related names look like they are building a base to move higher from. I'd like to see it try to maintain the 20MA as some support, but if it doesn't, it's not a deal breaker.
EEM has the best options, so I might be adding something from that eventually.
"Panda Bear" coming out to playThis is straight from my meditation. I was trying to ask about the market and getting distracted, but as soon as I came back to quiet, I received, "panda bear". I thought maybe it's a company or mascot until I actually googled it.
This is in alignment with a LITERAL bear that visited a cabin we wer

ASHRStill keeping the uptrend line has said enough.
Hopefully next rally can give it enough cushion for second leg down.

Add quite a bit ASHR hereASHR is testing upper BB on weekly and CN1 is testing long term support.
Added ITM short term weeklies and longer term OTM calls.
Risky. May need to get rid in near term depending on price movement.
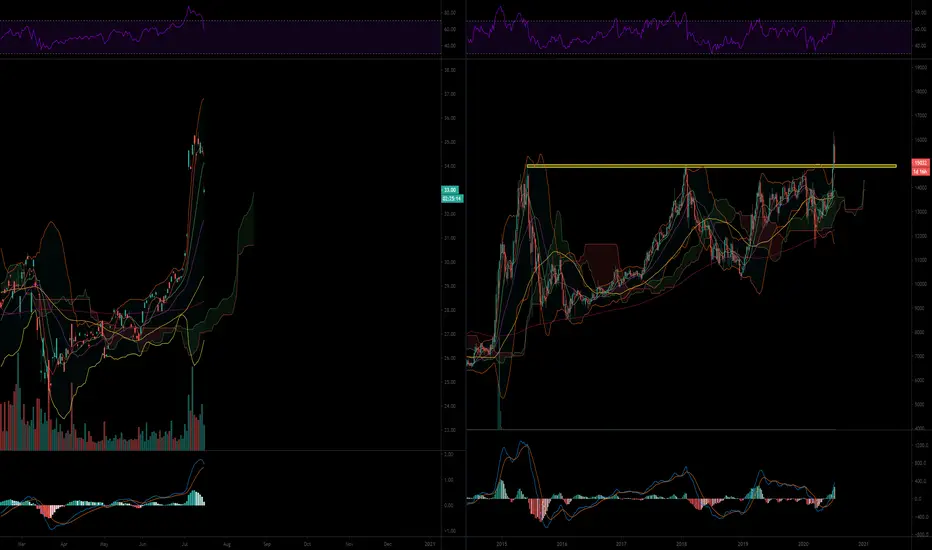

ASHR strong breakoutThis one is more longer term and could be a BTFD play in the coming weeks/months. Would be one of my major play for the remainder of the year as long as the yellow area in relative performance chart is hold.
Fundamentally, it is more of play who will recover first from COVID-19.
Weekly volume is


See all ideas
Summarizing what the indicators are suggesting.
Oscillators
Neutral
SellBuy
Strong sellStrong buy
Strong sellSellNeutralBuyStrong buy
Oscillators
Neutral
SellBuy
Strong sellStrong buy
Strong sellSellNeutralBuyStrong buy
Summary
Neutral
SellBuy
Strong sellStrong buy
Strong sellSellNeutralBuyStrong buy
Summary
Neutral
SellBuy
Strong sellStrong buy
Strong sellSellNeutralBuyStrong buy
Summary
Neutral
SellBuy
Strong sellStrong buy
Strong sellSellNeutralBuyStrong buy
Moving Averages
Neutral
SellBuy
Strong sellStrong buy
Strong sellSellNeutralBuyStrong buy
Moving Averages
Neutral
SellBuy
Strong sellStrong buy
Strong sellSellNeutralBuyStrong buy
Displays a symbol's price movements over previous years to identify recurring trends.
Related funds
Frequently Asked Questions
An exchange-traded fund (ETF) is a collection of assets (stocks, bonds, commodities, etc.) that track an underlying index and can be bought on an exchange like individual stocks.
ASHR trades at 500.000 MXN today, its price hasn't changed in the past 24 hours. Track more dynamics on ASHR price chart.
ASHR net asset value is 516.92 today — it's risen 1.52% over the past month. NAV represents the total value of the fund's assets less liabilities and serves as a gauge of the fund's performance.
ASHR assets under management is 39.19 B MXN. AUM is an important metric as it reflects the fund's size and can serve as a gauge of how successful the fund is in attracting investors, which, in its turn, can influence decision-making.
ASHR price has fallen by −9.73% over the last month, and its yearly performance shows a 24.69% increase. See more dynamics on ASHR price chart.
NAV returns, another gauge of an ETF dynamics, have risen by 1.52% over the last month, showed a −7.50% decrease in three-month performance and has increased by 25.98% in a year.
NAV returns, another gauge of an ETF dynamics, have risen by 1.52% over the last month, showed a −7.50% decrease in three-month performance and has increased by 25.98% in a year.
Since ETFs work like an individual stock, they can be bought and sold on exchanges (e.g. NASDAQ, NYSE, EURONEXT). As it happens with stocks, you need to select a brokerage to access trading. Explore our list of available brokers to find the one to help execute your strategies. Don't forget to do your research before getting to trading. Explore ETFs metrics in our ETF screener to find a reliable opportunity.
ASHR invests in stocks. See more details in our Analysis section.
ASHR expense ratio is 0.65%. It's an important metric for helping traders understand the fund's operating costs relative to assets and how expensive it would be to hold the fund.
No, ASHR isn't leveraged, meaning it doesn't use borrowings or financial derivatives to magnify the performance of the underlying assets or index it follows.
In some ways, ETFs are safe investments, but in a broader sense, they're not safer than any other asset, so it's crucial to analyze a fund before investing. But if your research gives a vague answer, you can always refer to technical analysis.
Today, ASHR technical analysis shows the strong sell rating and its 1-week rating is sell. Since market conditions are prone to changes, it's worth looking a bit further into the future — according to the 1-month rating ASHR shows the sell signal. See more of ASHR technicals for a more comprehensive analysis.
Today, ASHR technical analysis shows the strong sell rating and its 1-week rating is sell. Since market conditions are prone to changes, it's worth looking a bit further into the future — according to the 1-month rating ASHR shows the sell signal. See more of ASHR technicals for a more comprehensive analysis.
Yes, ASHR pays dividends to its holders with the dividend yield of 1.13%.
ASHR trades at a premium (2.43%).
Premium/discount to NAV expresses the difference between the ETF’s price and its NAV value. A positive percentage indicates a premium, meaning the ETF trades at a higher price than the calculated NAV. Conversely, a negative percentage indicates a discount, suggesting the ETF trades at a lower price than NAV.
Premium/discount to NAV expresses the difference between the ETF’s price and its NAV value. A positive percentage indicates a premium, meaning the ETF trades at a higher price than the calculated NAV. Conversely, a negative percentage indicates a discount, suggesting the ETF trades at a lower price than NAV.
ASHR shares are issued by Deutsche Bank AG
ASHR follows the China Shenzhen SE / CSI 300 Index. ETFs usually track some benchmark seeking to replicate its performance and guide asset selection and objectives.
The fund started trading on Nov 6, 2013.
The fund's management style is passive, meaning it's aiming to replicate the performance of the underlying index by holding assets in the same proportions as the index. The goal is to match the index's returns.