BAK - Predictive Scales, Forecast & TargetsBAK - Braskem, S.A., NYSE
Predictive Scales
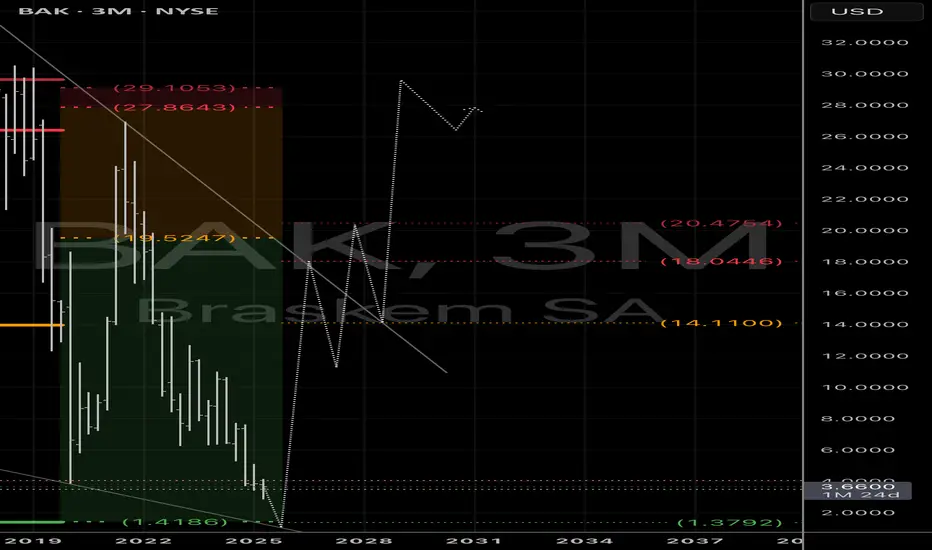
- S: pending activation at 1.3964
- M: pending activation at 1.4186
- L: pending activation at 1.3792
Forecast & Targets
- ST: IF carving lower lows, THEN bullish reversal awaits at 1.4186-1.3792 range
- MT: pending reversal
- LT: bullish
#BAK #CROW2.0
BAK/N trade ideas
Braskem's Potential Buyer Sparks Investor InterestIn a dynamic turn of events, Latin America's leading petrochemical company Braskem ( NYSE:BAK ) finds itself in the midst of a bidding war as a new potential buyer emerges for Novonor's stake. The revelation of a third competitor conducting due diligence has sent ripples through the market, igniting investor interest and driving shares to new heights.
Entering the Race:
With Petrobras and Abu Dhabi National Oil Co. already engaged in due diligence, the emergence of a third contender adds an intriguing dimension to Braskem's future. While Chief Financial Officer Pedro Freitas refrained from disclosing the bidder's identity, speculation points to Petrochemical Industry (PIC), a subsidiary of Kuwait Petroleum Corp., as a likely candidate. The prospect of a new investor replacing Novonor, Braskem's troubled controlling shareholder, has long been anticipated and could signal a transformative shift for the company.
Market Response:
The news of a potential buyer has sparked a flurry of activity in the market, with Braskem's shares experiencing a significant uptick. Investors are buoyed by the prospect of renewed interest in the company and the potential for strategic partnerships that could unlock value and drive growth. The stock's rally underscores investor confidence in Braskem's resilience and potential to thrive amidst evolving market dynamics.
Strategic Imperatives:
As Braskem ( NYSE:BAK ) navigates this pivotal juncture, strategic imperatives come into sharp focus. CEO Jean Paul Prates' vision of welcoming a new investor aligns with the company's broader strategy of fortifying its position in the petrochemicals industry. The possibility of forging partnerships with industry stalwarts like Adnoc holds promise for Braskem's long-term sustainability and competitive advantage.
Challenges and Opportunities:
Amidst the excitement surrounding the potential sale, Braskem faces challenges on multiple fronts. The additional provision made for the collapse of a salt mine in Brazil underscores the company's ongoing operational challenges. However, with prudent management and strategic foresight, Braskem ( NYSE:BAK ) is well-positioned to navigate these hurdles and emerge stronger.
Looking Ahead:
As Braskem ( NYSE:BAK ) embarks on this journey of transformation, the path forward remains uncertain yet ripe with opportunity. The company's ability to attract a strategic investor will not only shape its future trajectory but also have far-reaching implications for stakeholders and the broader industry landscape. With resilience, agility, and a clear strategic vision, Braskem is poised to chart a course towards sustainable growth and long-term success.


$BAK - RIP to my risk exposure Super wild chart. Don't get me wrong - despite the bullish divergence in MFI + RSI, I think it's hella ugly (candle-wise, at least). When I developed the MA strategy I use in all my posts, I documented (still do) certain setups & patterns to determine super alpha trades vs. the black swans rejects. I normally wouldn't post anything that'd make me look like that guy that does a wave pattern w/ the target entry either 2000% above / below the current price, so this one is a first (not 2000% gain but, definitely far-fetched). I have at least 15-20 types of definitive reference patterns based on maybe 4-8 broad categories (white curve of 55 low MA, color drops (typically > -5% drops), bruised re-traces (180WMA below 789WMA, etc.,) I've seen a few like $BAK with some similarities but also a few differences. Originally wanted to categorize the setup as "Holy trinity". The bounce / up-sides in any pattern react the same - but since 20EMA & white curve are 2 most important aspects of the setup in general, it's not often they bounce almost perfectly off 2 different minor averages as a firm support level. Super complex, hella rare, but easily recognizable for me. 85% success rate of seeing 200%-223% up-side (if all else equal), but since I only have a handful of references w/ respective differences, maybe 60% will see LT price target within a reasonable amount of time to generate max alpha. Although this isn't the exact match, the 2nd most important concept in all my posts is the white curve (55 low MA). For that to bounce off of a higher level than 20 EMA, most definitely represents bulls-strength - especially if remaining above minor (lower) MA's. If it weren't for the recent gap-up, I most likely wouldn't have looked twice @ the chart. Long story short - 200% -223% target for me. Green line above 200% (below 223%) is short entry, & marked short target as well just based off today's glimpse. I'll look through some examples just to clarify - Sorry but not too sorry for the extra-ness


Compra em BRMK5Operação de compra em BRKM5. Há uma divergência entre o preço e o estocástico sinalizando possível correção da tendência baixista até a média de 20 períodos além da sinalização da saturação das posições vendedoras.
Entrada em 18,93 com Stop em 18,00 e Alvo em 21,78.


pennies to thousands foreign picksouth american chemical manufacture
like international stocks uo to 21 price
past cloud
past key moving averages
relative strength money flow good
above cloud on weekly
get our book to read about money management and diversification
check daily first
