BRKB trade ideas
Retracement DueThe fall since January 18th has been retraced perfectly by almost 50 % and now I am expecting a little swingback towards the resistance at around 205 before the decline can continue.

$BRK.B Berkshire Hathaway is Giving a Buy SignalThe incredibly accurate Megalodon indicator just gave us a buy signal signifying that $BRK.B is good bet come market open! If you want to know how to use this indicator for yourself, send me a message!


Rise CorrectedWe have corrected the previous rise by less than 50 % and are looking for a continuing rise. This is a sign that there is still sufficient buying interest at this levels.

BERKSHIRE HATHAWAY INC. (BRK.A): One More Dip Before A Reversal?Find Winning Trades In Seconds >> efcindicator.com (Special Discount)
Correction in progress... a lower low is quite acceptable before continuing the bullish trend.

Berkshire Hathaway Inc. Berkshire Hathaway could have much further to drop. This level of plung would be culminate into roughly $100 billion loss. Could Buffett be selling?


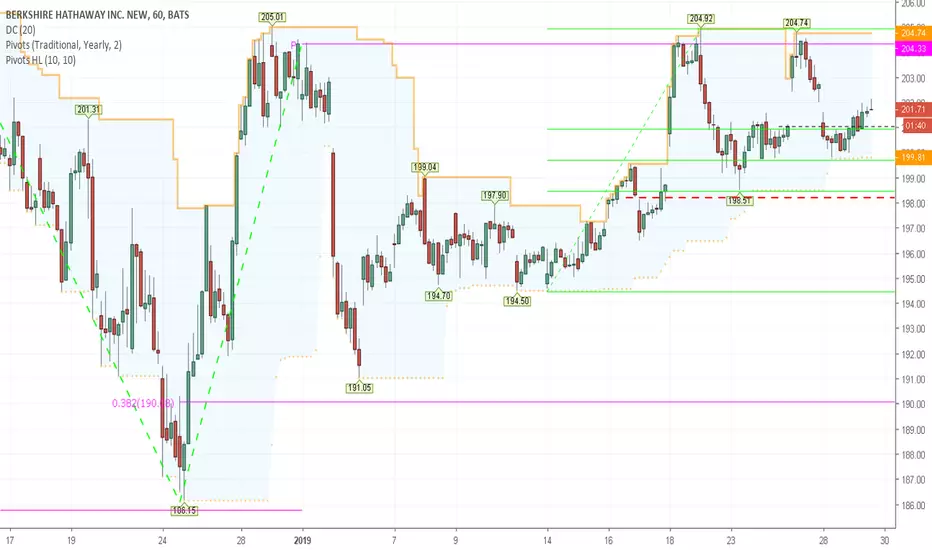
$BRK.B potential short targetThe market correction is highly likely to continue in 2019. Here is the potential buy/short target for BRK.B

time for BERKSHIRE HATHAWAY TO TAKE A BREAK FROM BULLSSince the 1980s, Warren buffet's berkshire hathaway has seen tremendous growth with some ups and downs in between. But it's time to take a break. The MACD The shows that there will be higher
highs in the future. but for now, and internal divergence and the unique move of the wave comming down gives me enough proof that 30% crash or more is imminent for BERKSHIRE HATHAWAY. This crash could last for more than 2 years.


Berkshire Down But Not OutMulti month channel support trendline may act as support for a bullish after earnings

Berkshire Falling wedge doom again?Looks like OTC:BERK is setting itself up for failure again, as in 2009 to retrace quite a bit.


BERKSHIRE HATHAWAY INC (BRK.A) - NASDAQ - Touch all time highBRK touched all time high price, I think we need small correction in here guys.
After correction we have bounce back and the target in the chart.
Good luck for everyone!

Next bubble coming?"History doesn't repeat itself but it often rhymes." (Mark Twain)
Wave count shows that we could see an end of the bull run. In previous bubbles we saw a double top with a declining RSI.
