Celanese Corp | CE | Long at $39.64Celanese Corp is another chemical company (like Dow Inc) crushed by tariffs and economic headwinds. It's dropped -78% in one year.... However, this is a very strong company with strong credit market interest and no immediate liquidity crisis. From a technical analysis perspective, this... like in 2008 and 2020... is the time to gather shares given it has reached the "abysmal crash" levels based on my selected simple moving averages. In the past, recovery to new highs has taken 1-2 years. History doesn't always repeat, but fear is opportunity in the stock market. If negative news continues to reign, a dip into the high $20's isn't out of the question.
If the company can squeak through 2025 and not continue to stack debt (debt/equity=2.43x), the growth opportunity into 2027-2028 looks promising.
I'm keeping my targets into 2026 low, but this could be a good buy and hold for the right investor.
Targets:
$47.00
$54.75
CE trade ideas

$CE Ready for Major Bullish Move as It Approaches Key SupportThe price is currently sitting at a strong support level which also coincides with the bottom of a historical bullish trendline . These confluences suggest a high probability of a reversal to the upside .
Additionally, volume has increased , signaling growing interest and potential momentum buildup in the stock. Notably, a doji candle formed on the January monthly chart , which typically indicates market indecision and potential reversal points.
The ATH (All-Time High) isn't far from the current chart structure, making this setup particularly attractive in terms of risk-reward. Based on a technical analysis, we are looking at a 1:27 risk-reward ratio to the ATH , making this trade highly favorable.
Given the combination of support, bullish trendline, volume increase, and the doji candle, I’m bullish on NYSE:CE in the medium to long term .

CE - Dec 24 100SMA StrongWeak BounceCE
Premarket entry to capture price as it is within our Stdev range and we can be ahead of the crowd as we expect the greater force (RUT) to continue dropping
Sector: Materials - Chemicals
9 Dec - Scott Richardson, currently Chief Operating Officer, has been appointed Chief Executive Officer and will join the Board of Directors, effective January 1, 2025.
Nov 24 earnings
- CEO Lori mentions demand struggles
- Reduction in the construction, paint and coatings market
- Demand destruction for derivatives, particularly in China for things like EVA into the solar markets
- BMO Capital Markets downgrades CE - “the chemical maker faces ongoing weakness in Europe and China amid excess production capacity for products such as nylon and what are known as acetyls.”
- Revenue is stagnant, but there is EPS growth
ADR 3.16%
Short Interest: 4.64%
Does it respect the H1 100SMA (Min 3Months): Yes
Is it a Hype Thematic (AI, Solar): China’s demand deceleration epecially in EVs and Solar.
100SMA StrongWeak Bounce 🏀 (0.5R) v1.0
Trading risk at 0.5R as we are testing this strategy
This trade model is based on us riding the 100SMA trend waves of the strongest and weakest companies. It only executes well when greater force (RUT & SPX) is trending. Entries are at greater force key levels when it is consolidating. When greater force is taking off it is too late.
Entry
Within Stdev 100 zone
SL = ATR14 * 2 (Run full course no early exits)
Trailing stop (Previous Day Low or high)
Price launch off (D1)
D2 Closes
D3 Move SL to D2 Low

CE (swing trade)currently hitting a major trendline from 2008, i expect a big bounce with around 20% gains from here

CE - LONGHere is the long potential with max RR 2:1
1. We reached a 50% demand zone + 50% of SNDR
2. no flip yet
3. Volume confirmation
4. RSI bullish divergence
VSA score: 431

Celanese Corporation (CE) - Frequency Formula Strategy - LongStrategy Overview: The Frequency Formula
Our trading strategy, "The Frequency Formula," is built on cutting-edge Fourier Wave Transform theory. The strategy utilizes four unique indicators: the Frequency Formula Chop Indicator (FF-CI), Frequency Formula Trend Indicator (FF-TI), the Frequency Formula Volume Indicator with Combined Ratios (FFVI-CR), and the Frequency Formula Net Buy/Net Sell Volume Indicator (FF-NBNS). Together, they identify optimal entry and exit points based on changes in market trends, volumes, and sentiments.
Why Now Is a Good Time to Enter
The FF-CI and FF-TI suggest that the current market chop and previous bearish trend are transitioning into a solid upward trend. Simultaneously, the FF-UVI-CR indicates increased buying volume and positive sentiment, suggesting strong support for the upward price movement.
What to Look for When Exiting
Keep an eye on our FF-VMI-CR and FF-NBNS Indicators. When the FF-VMI-CR indicator positive volume (blue) and negative volume (red) signals converge or "squeeze", this indicates a significant increase in net selling volume and might indicate a potential trend reversal; also, watch the FF-NBNS indicator's net-selling value (red) to increase and close at any value greater than zero, at this point you should exit the position.
Remember to always manage your risk, and don't invest more than you can afford to lose. Happy trading!


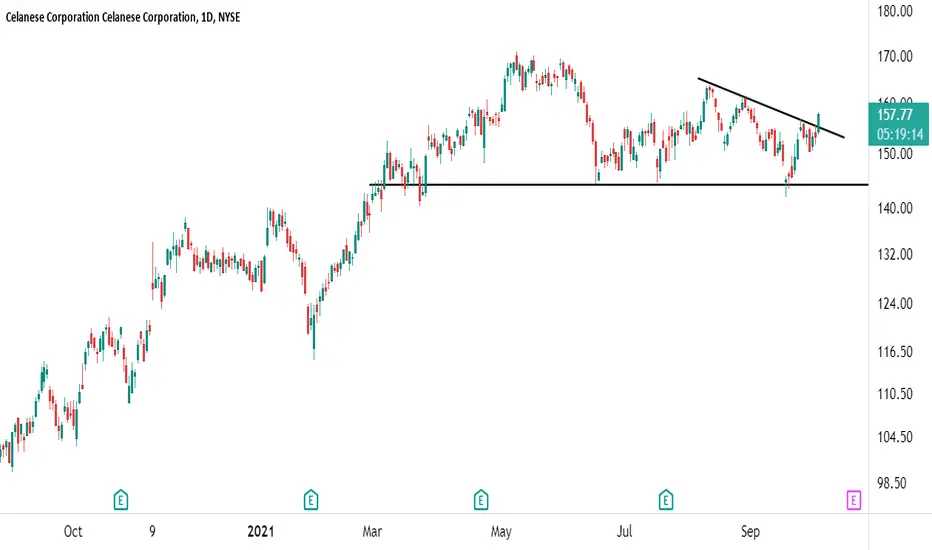
CE showing weaknessOn the verge of breaking lower...if it holds this neckline it could push higher.
Below all key Moving Averages

Celanese CorpThe trend is currently down. A possible head and shoulders pattern is forming. The head of the pattern coincides with previous strong rejection. This level will most likely be defended again if the price gets near again. When the price reaches the neckline or even further, wait for a reversal pattern, such as the double bottom, etc, then go long. First TP better places shoulders. Then head.


$CE with a bullish outlook following its earnings #StocksThe PEAD projected a bullish outlook for $CE after a Negative over reaction following its earnings release placing the stock in drift C with an expected accuracy of 83.33%.

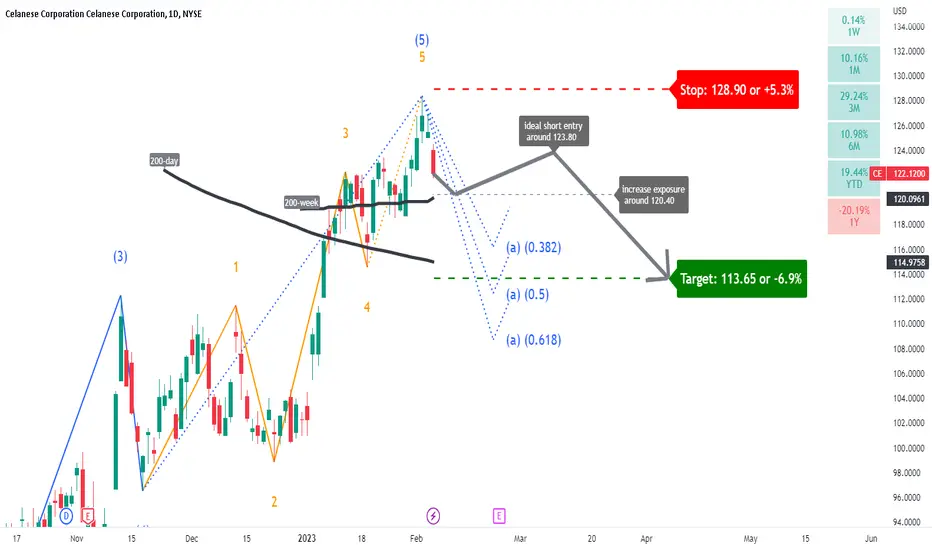
CE: corrective price actionA brearish trend is applicable.
Short entry as close to 123.80 as possible.
Increase the short exposure for a break below 120.40.
Profit target is set at 113.65 (wave a)
Stop-loss set at 128.90.
Keep an eye on the 200-week and 200-day moving averages, which might act as major support.
$CE with a Bearish outlook following its earnings #Stocks The PEAD projected a Bearish outlook for $CE after a Negative Under reaction following its earnings release placing the stock in drift D.
$CE with a Neutral outlook following its earnings #Stocks The PEAD projected a Neutral outlook for $CE after a Positive over reaction following its earnings release placing the stock in drift B with an expected accuracy of 75%.
CE, We need more correctionHello guys
According to the chart you can see the price is moving downward trend and it has need more correction to have good R/r then we have permission to take short position until the target.
You should take signal at first then dont forget use stop loss and observe to your capital management.
Take a look on volume guys dont forget to check it, And dont forget to risk free and manage your position.
Everything is shown on chart, If you have question send us messages
Good Luck
Abtin


$CE / LongScan Criteria
Does this stock meet my custom 12 point scan criteria? Yes, came through on my 40/40 Sales and Earnings Scans
Structural Checklist
1. Can a proven price patterns be identified? Yes, Inverse H&S / CWH
2. Is the 50D SMA trending up? Yes
3. Has price moved >20% since its last consolidation? Yes
4. Is the weekly RS above its Zero Line? Yes
5. Does price action suggest the stock is consolidating / digesting the recent price move? Yes
6. Is the price consolidation longer > 20 days? Yes
7. Has price volatility contracted from left to right? Yes
8. Has volume volatility contracted from left to right? Yes
9. Are there visible signs of demand within the base? Not obvious
10. Are there visible signs supply has been absorbed? Yes
Pivot Buy Point (Last 3 Bars)
1. Is there a visible Tight Zone? Yes
2. Have there been 3 Tight Closes? Yes
3. Has there been a Constructive 3 Bar Correction? No
4. Is there a Bullish Inside Bar? No
AND
1. Has volume dropped dramatically? 2x blue dots in the last 4 bars
2. Can risk be managed under 8% in one of 3 ways? Yes
Scan Score (Minimum 12/12)
All Trading Dirty stocks have a Scan Score of 11
Structural Score (Minimum 7/10) 9.5
Entry Score (Minimum 1/4 then 2/2) 3.5

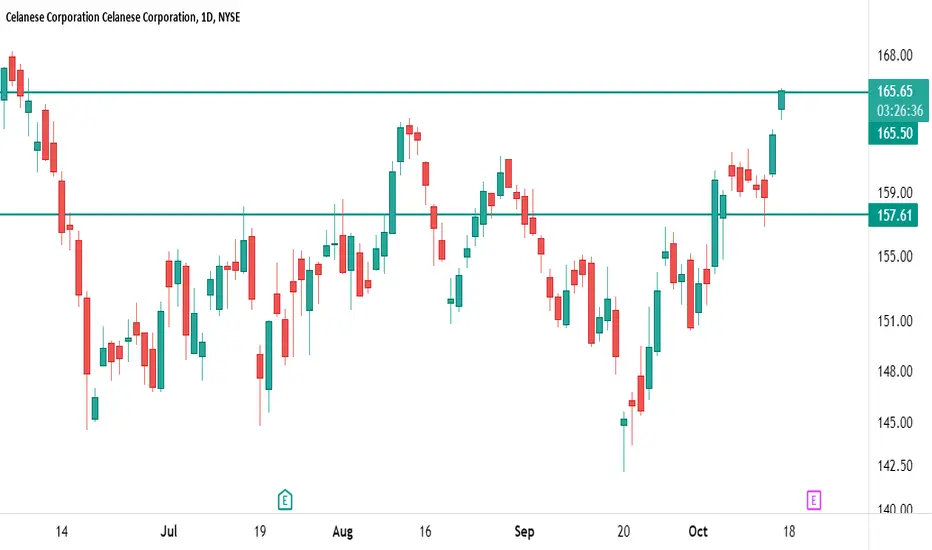
Celanese Corp: Take Profit +5%Celanese Corp: Take Profit +5%
Pre-earnings, this is a level to take profits ($165.65)
Original idea attached.
For more real-time insights and trade ideas, get in touch today.
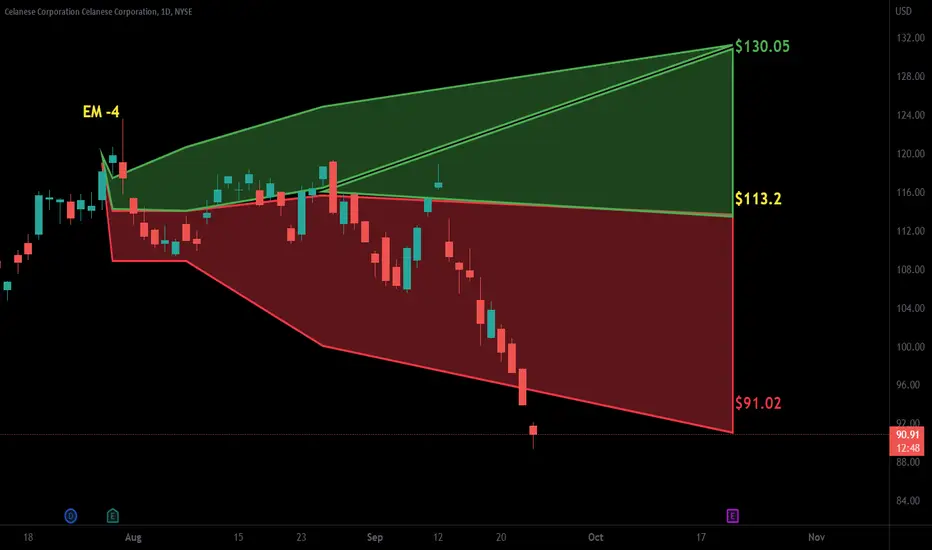
CE - Lower into EarningsCE looks like it will weaken taking price to the 132 area. Needs to break its 200 day, but as its the second time in a short duration, probably has more success.
Note, it had two bearish engulfings in a row.

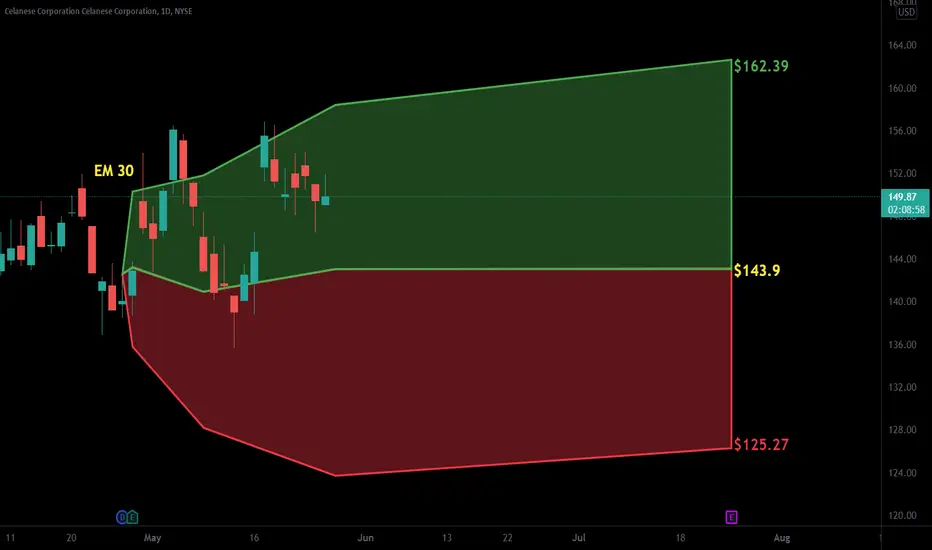
Trade Setup: Celanese CorpBuy: $157.61
Stop: $153.20
Target: $169.00
A global chemical and specialty materials company.

Post-earnings spike CEPicked up with a Limit around 1pm on CE off the post-earnings spike this morning.

