Charter Communications | CHTR | Long at $353.00Charter Communications NASDAQ:CHTR has hit the bottom of my historical simple moving average band. It may consolidate for a while around the current price or dip in the near-term (potentially in the $270's), but dropping interest rates will be extremely beneficial for telecommunication companies in the long-term. There are two open price gaps on the daily chart ($700's) that will inevitably close - just a matter of when. With a 90M float and 12% short interest, it's a stock that could get interesting if upward momentum takes over. Earnings and cash flow growth are anticipated through 2027, so at $353.00, NASDAQ:CHTR is in a personal buy zone.
Target #1 = $400.00
Target #2 = $500.00
Target #3 = $600.00
Target #4 = $700.00
Target #5 = $740.00
CHTR trade ideas

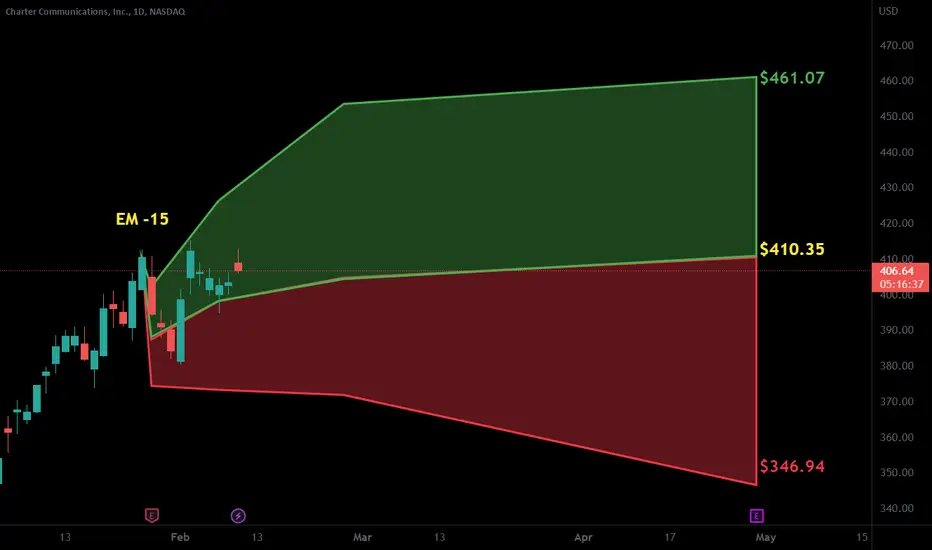
CHTR Charter Communications Options Ahead of EarningsAnalyzing the options chain and the chart patterns of CHTR Charter Communications prior to the earnings report this week,
I would consider purchasing the 360usd strike price Calls with
an expiration date of 2025-9-19,
for a premium of approximately $22.35.
If these options prove to be profitable prior to the earnings release, I would sell at least half of them.

CHTRThis Weekly FORECAST
Opportunity for CHTR. This setup trading idea is for intraday. >> TAYOR
Risk Factors:
1. Market conditions, unexpected news, or external events could impact the trade.
2. Always use risk management strategies to protect your capital.

CHTR, to long or to short.Charter Communications (CHTR) reported earnings recently, and the stock closed up +16.62%. Despite the significant price increase, the earnings report itself did not justify such a dramatic rise. Instead, the movement can be attributed to the stock testing liquidity levels.
Understanding the Price Movement:
Liquidity Testing: Markets often move from one area of liquidity to another. Pre-market buyers anticipated this move once the stock surpassed the recent pivot at $340. The next significant liquidity level was around $374.42, approximately $375.
Intraday Reversal: Upon reaching this level, the stock reversed intraday and closed just below $370. This indicates that liquidity at this level was tested, and sellers stepped in.
Technical Analysis and Trade Plan:
Short Bias: The trade is short-biased if the stock closes below the $375 level with a bearish daily candle. This would indicate a rejection at the liquidity level and hold the character of a potential reversal.
Long Bias: For a long position, confirmation is needed with the stock closing above $373 on Monday with 1.5 times the relative volume (Rvol). This would suggest sustained buying interest and a potential continuation of the uptrend.
Volume and ATR Analysis:
Daily Candle: The daily candle on the earnings report day was above the Average True Range (ATR), indicating significant price movement.
Rvol: The Rvol was 2.94, showing a healthy volume that is expected for such an earnings gap.
Key Levels to Watch:
Above $375: If the stock can sustain above $375, the next target level would be $420, indicating a significant upside potential.
Below $375: If the stock closes below $375, the downside targets could be back to $340 - $320, suggesting a return to prior levels of support.
Charter Communications (CHTR) experienced a substantial price increase post-earnings, primarily driven by liquidity testing rather than the earnings report itself. Traders should watch for confirmation of direction by observing how the stock behaves around the $375 level with corresponding volume indicators. This will provide a clearer picture for either short or long trade setups.

CHTR is BullishPrice has given a good breakout and bulls seem to be in control of the price action. If the bullish momentum sustains like this we can expect new highs for the price. Targets are mentioned on the chart.

CHTR - Bottom reversal in placeCHTR is looking at a potential bottoming out after strong buying pressure was seen last Friday. Furthermore, the stock has formed an inverted head and shoulder formation.
Prices are trending above all ichimoku indicator. Indicating strong further upside going forward.

CHTR - Looking massive, big movement coming?NASDAQ:CHTR looking oversold, and several bullish indicators converge in the chart right now. A 0.709 fibonacci retracement of the price landing right in an historical support/demand zone. In addition, a hughe bearish divergence from previous low. Targets could be very high if a good bullish movement plays out.

Charter Communication - Reverse Flag is in the making
Charter Communication - Reverse Flag is in the making, should we go short on it?

Charter Communications Isn't A Buy ... Yet.Hey everyone! Here's hoping your trading has been going well recently.
Today, we're taking a look at Charter Communications, NASDAQ:CHTR which has to hold the title for one of the most beaten down stocks over the last couple years. Dropping from all-time highs near $800 per share, a recent downswing in FCF has caused shares to plummet, and increased questions about the company's large ~$100 billion debt pile.
Despite the concerns on the part of legacy investors, we like the company over the long term. The debt is high and some of the legacy businesses are in slow, secular, profitable decline, but new growth in the wireless and connectivity businesses should prove to offset this. In addition, the company has been very active in buying back it's stock, which is extremely positive from a supply standpoint.
Analysts remain confident about CHTR's earning power into the future, and the company's infrastructure should enable high FCF generation, which means that there could be serious gains to be had.
That said, it's not the right time to buy shares just yet, in our view.
Recently, an earnings miss sent the stock plummeting below yearly lows, and into deeply oversold territory:
Due to this, it's not clear if / when the stock will rebound.
We'll be watching momentum in the stock to turn around. Once it does, then it's time to jump into this stock guns blazing, assuming nothing changes from a fundamental standpoint. Specifically, we'll be looking for consecutive green candles before jumping in:
Selling puts on this stock is also an intriguing idea, potentially a couple months out with a strike price near $250 - if you're a yield trader.
TLDR: CHTR looks like a solid long term buy, but should be avoided until momentum turns around and investors are once again ready to back the stock.
Stay safe out there!
Want more high-quality trade ideas? Follow us below. ⬇️⬇️

$CHTRThere's rumors of a very large bet on CHTR.
Will the stock go up or down? Stay tuned folks, same bat channel same bat time.

Charter ($CHTR) IdeaNASDAQ:CHTR
Charter Communications (CHTR) - Trade Plan Update
Trade Setup: Anchored VWAP (AVWAP) Rebound
Rationale:
The initial earnings release day was marked by a distinctly bearish sentiment, with CHTR closing below two critical support levels: the psychological threshold of $375 and the established support at $374.42. Observing the stock's performance into Day 4, there has been a notable turnaround, with CHTR appreciating by 10.05% to $406.51 from a low of $369.38. This recovery and upward momentum indicate a shift in market perception from bearish to bullish, aligning with typical bullish behavior.
Entry Strategy:
The entry point will be identified upon CHTR’s retracement to the AVWAP level derived from the earnings release. This price action would indicate a fair value entry, offering a competitive position.
A conditional entry is set to trigger if CHTR tests and subsequently closes above the AVWAP, confirming buyers' control.
An order will be placed using a Buy Stop Limit at an identified intraday high, with the intention of execution on the following trading session.
A Stop Loss will be set below the previous day's intraday low to protect the trade from adverse movements.
Profit Targets:
The primary target is set at a breach above $400, with a subsequent goal of $411.98.
The strategy will be to scale out of the position in stages, securing profits systematically as the targets are achieved.
This trading plan is predicated on the assumption that the bounce off the AVWAP represents a substantial shift in momentum, and the outlined entry and exit parameters are designed to capitalize on this potential upswing while managing risk.

$CHTR: Chartering a Jet at 450?NASDAQ:CHTR has seen an incredible pop here and if there's any hopes for the market to continue higher I think we could see this move incredibly strong to the upside. If the market pulls back it may be worth DCA'ing as the momentum is incredible right now..Good luck traders!


Charter- Should We "Cut the Cord"?I am a technical trader so I will stick to the technicals for the most part on this one...
Technically, Charter's charts and price structure are pretty clean and straightforward.
We are at a decision point with good probability for movement in either direction.
With that said i would use the low as my stop loss if I am long and if i am a bear I would use the recent pivot high as my stop..
Fundamentals- lets be honest..when grandparents started buying firesticks and Roku boxes I knew cable was on its last legs..but cable isnt dead- yet

CHTR - If Support Is FoundA nice expanding triangle is evident on this chart if support is found at the 333 level.
This triangle is just the inverse of a symmetrical triangle.
Will there be continuation of this pattern? Lets see.

CHTR Potential Trade AlertThis is a top short target. Keep this name on your watchlist as its been lagging the communications sector.
If the communication sector sees weakness which we think it will, this name will be a relative weakness trade to the downside.
Earnings approaching is the major outlier event.

$CHTR with a neutral outlook following its earnings #Stocks The PEAD projected a neutral outlook for $CHTR after a negative under reaction following its earnings release placing the stock in drift D with an expected accuracy of 60%.
CHTR LongCharter Communications Inc Long confirmation ... As we see there was consolidation (130 M Total volume) Buyers were liquidated on $300 level, now it's time to kill sellers ! Market Makers are really cool at what they do ...

Charter: Possible Bearish Inverted Triangle??the current formation is a potential Broadening, with 5 rallies, but I find a Broadening bottom strange in a current economic situation and in the bottoms are rare and not even big enough to reverse such a trend
in my opinion it is more likely that at least one more rally will occur and become an inverted triangle of bearish continuation

Charter Communications +10% Some ideas that supports a 10% (more less) of recovering price in the next weeks
Double bottom
Support on EMA100(w)
Multitime frame analysis with stochastic rsi
Tobin's Q 0.92
PE Ratio 28.94
and CMF positive divergence
If it goes over +690 then could go up to 740 or 777 later.
This is not an investment advice


Charter Communications – Hidden Gem with Up To 85% Upside OpportIf you like this idea, please don’t forget to Boost it.
Fundamental Indicators:
Sector – Communication Services
US Business Cycle Stage – late cycle, when this sector is neutral
Revenue – consistently growing for the past 5 years, with 13% average annual rate
Profits – even more explosive growth, with 26% average annual rate
Net margin – decent 12% which has considerably increased since 2018
P/E – quite low with 13.6 ratio compared to S&P500 with 21 and Communication Services sector with 17.5
Liabilities - debt ratio is at 0.91 which is a little over the norm, Net Debt/ EBITDA is at 4.54 – no major problems with debt
Conclusion – great performance across all indicators apart from the debt ratio, which shouldn’t be a concern at this stage – stock likely to continue growing
Technical Analysis (Elliott Waves):
Main scenario of this idea suggests that we are still observing development of the global growth cycle which is currently at the stage of completing wave 5 of 5 (see higher timeframe graph)
The key elements of this scenario are Contracting Tringle of wave 4 that lasted between 2017 and 2019 which reflects accumulation phase, and the final fifth which is taking a complex shape
This final fifth wave is clearly shaping up by a choppy movement which indicates formation of an Ending Diagonal (see guidelines for Ending Diagonals below)
Waves 1 to 4 have already formed and wave 5 is just about to start
This may present a good long term opportunity with a target of $825 – up to 85% upside
This is a higher timeframe to reflect the full history of Charter Communications and to provide full wave count:
This is the link to the guidelines for Ending Diagonals
What do you think about Charter Communications and its short term prospects?
Also let me know if you would like to see other stocks, indices, Forex or Crypto analysed using Elliott Waves. And BOOST this idea if you like it.
Thanks

$CHTR with a Bullish outlook following its earnings #Stocks The PEAD projected a Bullish outlook for $CHTR after a Negative Under reaction following its earnings release placing the stock in drift D with an expected accuracy of 75%.
