CLSK / 3hNASDAQ:CLSK
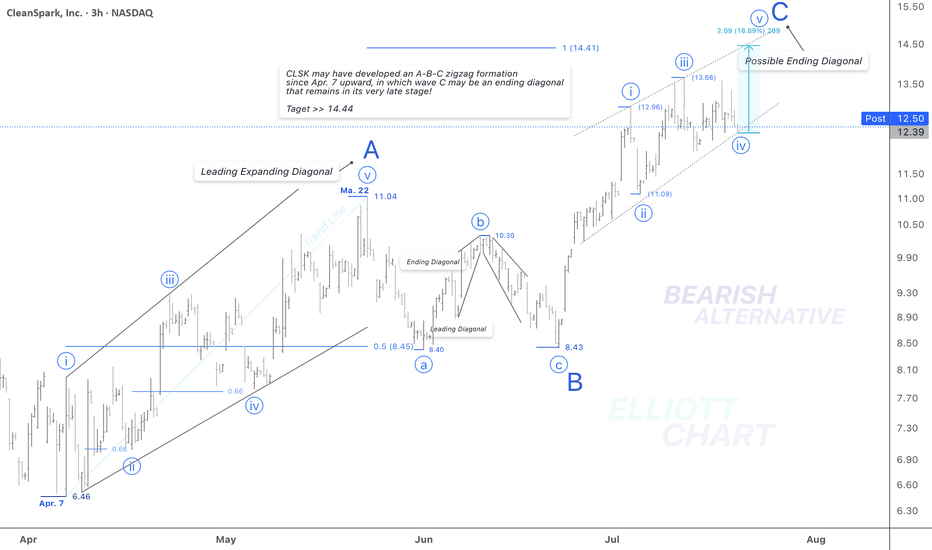
According to the bearish alternative in my weekly frame(not posted!), I'd analyzed the rising wave since April 7 as an A-B-C zigzag formation in correction of the Intermediate degree wave (B) <<. Not shown in this 3h-frame.
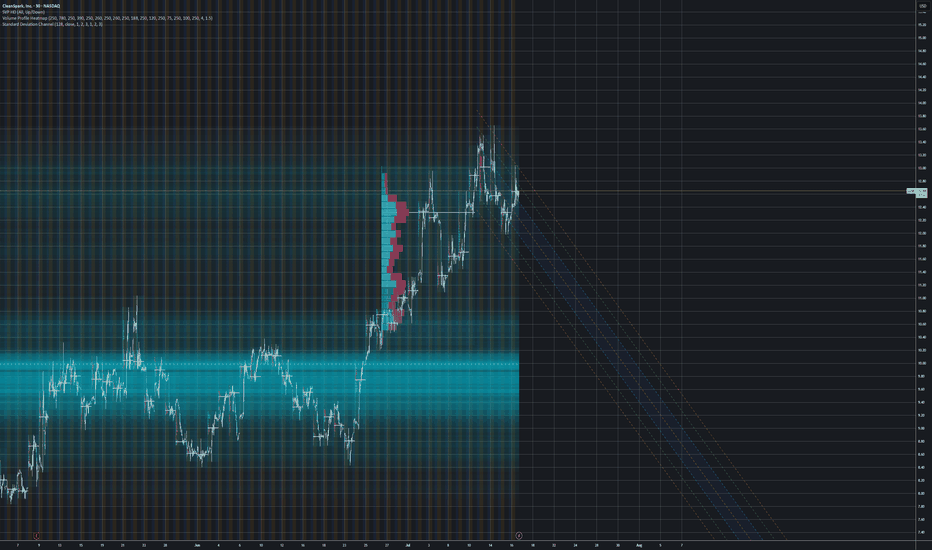
Wave Analysis >> As depicted in the 3h-frame above, the Minor degree wave C of the countertrend advance in wave (B) may thoroughly develop in an ending diagonal, which remains in its very late stage; a final advance in Minute degree wave v(circled) has begun its way up today to conclude the ending diagonal wave C of the entire correction of wave (B).
Trend Analysis >> After completion of the possible ending diagonal as Minor degree wave C, the trend will soon turn downward in an ultimate decline in Intermediate degree wave (C), which will likely last until the end of the year!!
NASDAQ:CLSK CRYPTOCAP:BTC MARKETSCOM:BITCOIN BITSTAMP:BTCUSD
#CryptoStocks #CLSK #BTCMining #Bitcoin #BTC
CLSK trade ideas
CLSK / 3hToday’s unexpected 2.6% decline, along with the continued development of an ending diagonal in the final leg of the correction, supports a reversion to the previously considered structure: an formation for wave iv (circled). This revised interpretation aligns more closely with the current price action and wave behavior.
I continue to view Minor wave C as an impulsive sequence as well, which now appears to be entering its final stage—an anticipated advance in wave v (circled), with a projected Fib target in the 14.36–14.80 range.
Wave Analysis >> While the current outlook on NASDAQ:CLSK remains consistent with previous analysis, the 3-h frame above shows that Minor wave C—completing the corrective advance of wave (B)—appears to be unfolding in an impulsive sequence, likely entering its final stages.
Within this structure, Minute wave iv (circled) has taken the form of an correction. A final push higher in Minute wave v (circled) is now anticipated, which would complete the ongoing wave C and, in turn, mark the conclusion of the countertrend advance in Intermediate degree wave (B).
Trend Analysis >> Upon completion of Minor wave C, a broader trend reversal to the downside is anticipated, marking the beginning of the final decline in Intermediate wave (C). This bearish phase may develop over the coming months and could persist through the end of the year.
#CryptoStocks #CLSK #BTCMining #Bitcoin #BTC
NASDAQ:CLSK MARKETSCOM:BITCOIN CRYPTOCAP:BTC BITSTAMP:BTCUSD
CLSK / 3hThe modest and unexpected 2.5% decline in NASDAQ:CLSK today suggests a potential shift in the wave iv (circled) corrective structure—from the previously identified to a more complex combination.
This adjustment still fits within the context of the ending diagonal pattern in Minor wave C and reflects a deeper, yet corrective, move down. The overall outlook and wave structure remain unchanged.
Wave Analysis >> As illustrated in the 3h-frame above, Minor wave C—completing the corrective upward move of wave (B)—appears to be unfolding as an ending diagonal, now likely in its final stages. Within this structure, the Minute wave iv (circled) has formed a correction. A final push higher in Minute wave v (circled) is now expected, which would complete the ending diagonal pattern of wave C, and in turn, conclude the countertrend advance of wave (B).
Trend Analysis >> Upon completion of the potential ending diagonal in Minor wave C, the broader trend is anticipated to reverse to the downside, initiating the final decline in Intermediate wave (C). This bearish phase may extend through the remainder of the year.
#CryptoStocks #CLSK #BTCMining #Bitcoin #BTC
NASDAQ:CLSK CRYPTOCAP:BTC BITSTAMP:BTCUSD MARKETSCOM:BITCOIN
Bullish Flag Formation - Short term upside to $14 - BTC ATHIn the interim, the bull flag pattern can be delineated as follows based on the uploaded chart: The flagpole is represented by the upward surge from approximately $113,332 (near the green label at the chart’s lower left) to around $121,351 (inferred from the upper candlestick highs and the red label near 121,351.18). The flag portion consists of a downward-sloping channel, with the upper trendline connecting the recent highs at roughly $120,500 to $118,000, and the lower trendline linking the pullback lows from about $118,500 to $116,700. A breakout above the upper trendline ($118,500–$119,000) would project an upward extension equivalent to the flagpole’s length (approximately $8,000), targeting $126,000–$128,000 in the near term, assuming confirmation through increased volume and sustained support above $116,700.
Regarding the daily price forecast from July 28, 2025 (Monday), through August 1, 2025 (Friday), the projections are derived from the bull flag continuation pattern, cross-referenced with aggregated analyses from recent market data, technical indicators (such as RSI and MACD showing neutral-to-bullish momentum), on-chain metrics (indicating accumulation at $115,000–$117,000), and a distribution of expert predictions. These include short-term consolidation with a potential dip for liquidity clearance, followed by a breakout, aligning with historical post-halving cycles and institutional inflows. Note that cryptocurrency prices are inherently volatile and influenced by factors such as Federal Open Market Committee outcomes, ETF flows, and macroeconomic events; these forecasts are speculative and not financial advice.
• July 28, 2025 (Monday): Anticipated consolidation within the flag channel amid low weekend volume. Expected range: $116,800–$118,500. Key targets: Support at $116,700 (lower flag boundary, potential entry for accumulation); resistance at $118,500 (upper flag line, breakout watch level). Average closing prediction: $117,800, reflecting neutral sentiment with minor downside risk if global markets weaken.   
• July 29, 2025 (Tuesday): Possible test of lower support amid early-week volatility, potentially sweeping liquidity before rebounding. Expected range: $116,000–$119,000. Key targets: Downside at $116,000 (critical on-chain accumulation zone); upside at $119,000 (initial breakout threshold). Average closing prediction: $117,500, with a 40% probability of a brief dip followed by stabilization.   
• July 30, 2025 (Wednesday): Breakout attempt likely if support holds, driven by mid-week momentum and potential dovish policy signals. Expected range: $117,500–$120,500. Key targets: Support at $117,000 (mid-channel level); resistance at $120,000 (psychological barrier and prior high). Average closing prediction: $118,900, assuming bullish confirmation above $118,500.   
• July 31, 2025 (Thursday): Extension of upward movement post-breakout, with volume potentially increasing. Expected range: $118,500–$122,000. Key targets: Support at $118,000 (retest of breakout level); resistance at $121,000 (flagpole projection start). Average closing prediction: $120,200, supported by technical alignment and ETF inflow trends.   
• August 1, 2025 (Friday): Momentum continuation toward weekly close, with risk of profit-taking. Expected range: $119,500–$123,500. Key targets: Support at $119,000 (new floor post-breakout); resistance at $123,000 (extended target based on pattern measurement). Average closing prediction: $121,800, aligning with broader bullish forecasts for early August.   
CLSK / 3hNASDAQ:CLSK has been trading with a slight upward bias ahead of a potentially final advance, projected to gain approximately 25% with a target near $15.00.
Wave Analysis >> As illustrated in the 3h-frame above, Minor wave C—completing the corrective upward move of wave (B)—appears to be unfolding as an ending diagonal, now likely in its final stages. Within this structure, the Minute wave iv (circled) has formed a correction. A final push higher in Minute wave v (circled) is now expected, which would complete the ending diagonal pattern of wave C, and in turn, conclude the countertrend advance of wave (B).
Trend Analysis >> Upon completion of the potential ending diagonal in Minor wave C, the broader trend is anticipated to reverse to the downside, initiating the final decline in Intermediate wave (C). This bearish phase may extend through the remainder of the year.
#CryptoStocks #CLSK #BTCMining #Bitcoin #BTC
NASDAQ:CLSK CRYPTOCAP:BTC BITSTAMP:BTCUSD MARKETSCOM:BITCOIN
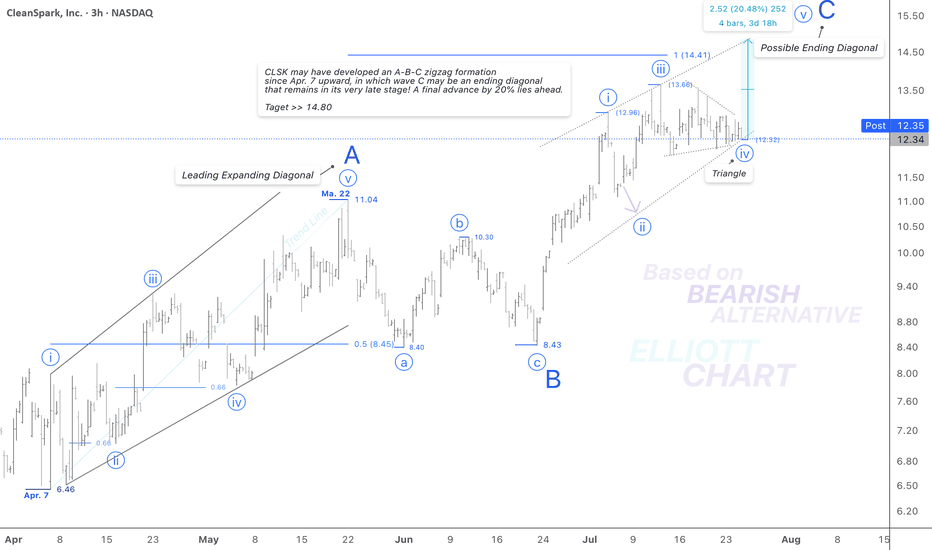
$CLSK / 3hNASDAQ:CLSK
According to the bearish alternative in my weekly frame(not posted!), I'd analyzed the rising tide since April 7 as an A-B-C zigzag formation in a correction of the Intermediate degree wave (B) <<. Not shown in this 3h frame.
Wave Analysis >> As illustrated in the 3h-frame above, the Minor degree wave C as the last part of the correction upward in wave (B) may thoroughly develop in an ending diagonal, which remains in its very late stage; after a triangle correction in Minute degree wave iv(circled) now a final advance in the same degree wave v(circled) is anticipated to follow very soon to conclude the ending diagonal wave C of the countertrend advance of wave (B).
Trend Analysis >> After completion of the possible ending diagonal as Minor degree wave C, the trend will soon turn downward in an ultimate decline in Intermediate degree wave (C), which will likely last until the end of the year!!
#CryptoStocks #CLSK #BTCMining #Bitcoin #BTC
NASDAQ:CLSK CRYPTOCAP:BTC BITSTAMP:BTCUSD MARKETSCOM:BITCOIN
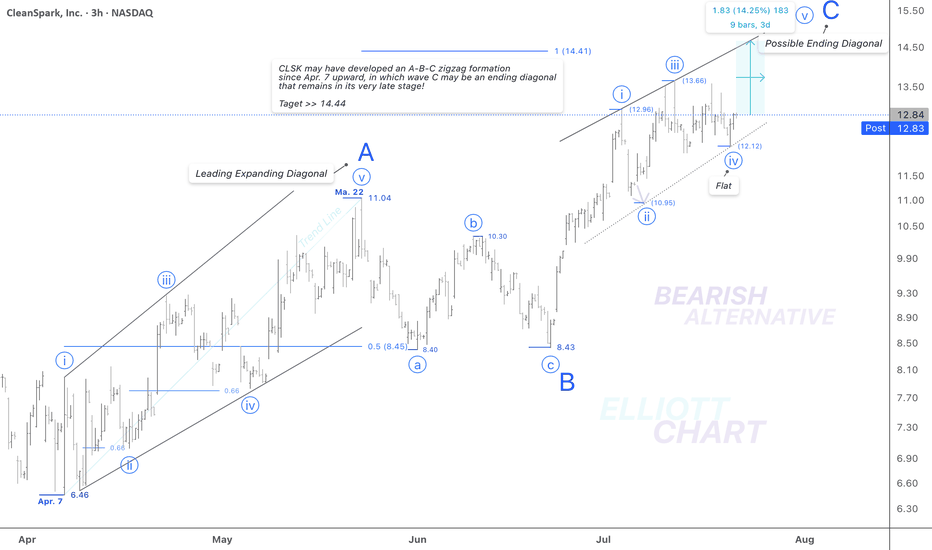
CLSK / 3hAccording to a bearish alternative in my weekly frame(not posted!), I'd analyzed the rising wave since April 7 as an A-B-C zigzag formation in correction of the Intermediate degree wave (B) >> Not shown in this 3h-frame.
Wave Analysis >> As depicted in the 3h-frame above, the Minor degree wave C of the countertrend advance in wave (B) may thoroughly develop in an ending diagonal, which remains in its very late stage, and a final advance of 17% lies ahead to conclude the ending diagonal wave C of the entire correction of wave (B).
Trend Analysis >> After completion of the possible ending diagonal as Minor degree wave C, the trend will change soon to downward in a decline of Intermediate degree wave (C).
#CryptoStocks #CLSK #BTCMining #Bitcoin #BTC
[$CLSK] CleanSpark Inc. - Farming [$BTC] LongNASDAQ:CLSK
no finanical advice
📑market outlook
+ Fed rate cut priced in --> short term risk-on environment
+ total FIAT-debasement in motion --> Precious &Crypto are poomping
- geo-political risk can drag down the 'weaker ANTI-Fiat' risk-on positions
💡idea
we want to farm BTC indirectly by selling covered-calls /placing cash secured puts
🧪approach
derivatives options with i.e. 0.1 BTC ~ 10,000 USD
🏁target
get 2% yield per month
⚠️ caution
Only weekly options: --> Crypto Cycle could take hits of -50% which would basically demolish your position
--> check weekly volume/sentiment on BTC
Don't forget:
⏳ Theta is our alley. Always have been!
[$CLSK] CleanSpark Inc. - Farming [$BTC] Long[ NASDAQ:CLSK ]
no finanical advice
📑market outlook
+ Fed rate cut priced in --> short term risk-on environment
+ total FIAT-debasement in motion --> Precious &Crypto are poomping
- geo-political risk can drag down the 'weaker ANTI-Fiat' risk-on positions
💡idea
we want to farm BTC indirectly by selling covered-calls /placing cash secured puts
🧪approach
derivatives options with i.e. 0.1 BTC ~ 10,000 USD
🏁target
get 2% yield per month
⚠️ caution
Only weekly options: --> Crypto Cycle could take hits of -50% which would basically demolish your position
--> check weekly volume/sentiment on BTC
Don't forget:
⏳ Theta is our alley. Always have been!
$CLSK Trapped between Critical Resistance and Support?NASDAQ:CLSK Shot through the weekly 200EMA and hit the weekly pivot resistance and was rejected into the High Volume Node (HVN) just below.
If the count is correct we should see price breakthrough in wave 3 after some consolidation and continue up after wave 2 tested the .618 Fibonacci retracement and HVN as support.
Heavy resistance HVN coupled with the R1 pivot at $20.40 will prove another challenge to overcome. Ultimately, if the count is correct AND Bitcoin doesn't tank we can expect a challenge of the all time highs up at $60.
I already closed partial take profit myself at the weekly pivot on a recent trade and will be looking to go long again to the those targets. Make sure to always be taking profits on the way as nobody has a Crystal ball!
RSI is currently printing a bearish divergence on the weekly so we need to see that negated.
Analysis is invalidated below $6.
Safe trading
CLSK / 4hNASDAQ:CLSK resumed advancing in its ongoing wave iii(circled) as anticipated, by 10.44% intraday today.
Wave Analysis >> According to the prior analysis, the advance will likely achieve the extension Fib-target at 20.06 as the extreme point of the impulsive third wave of the sequence of C.
Trend Analysis >> The Minor degree UPtrend would remain in progress on a larger degree trend upward >> Intermediate degree wave (B) as a countertrend!
#CryptoStocks #CLSK #BTCMining #Bitcoin #BTC
CLSK / 4hAccording to the prior analysis, NASDAQ:CLSK continued to advance 12.6% today.
Now, 70% of the anticipated rally lies ahead on the ongoing impulsive wave iii(circled).
Trend Analysis >> The Minor degree trend is up, now in an impulsive third wave in Minute degree towards the expected target.
The first Fib extension target >> 20.06
#CryptoStocks #CLSK #BTCMining #Bitcoin #BTC
Mega bull trend starts now, CLSKIn short:
1) Goldencross soon to be triggered.
2) too see how the stock could perform (with accumulated, low 200dma), we can look in 2023. It peaked in mid July. After explosive rally in november.
3) 13$ levels is the 50% fibonacci..
4) 1st Elliot wave - people are skeptical. 2nd - woohoo. 3rd wave - fomo.
//Advancing in relative strength (CLSK/SPX).
//Small cap ( AMEX:IWM ) outperformance due to rate cut cycle (starts in September). Evidence is yesterday broadening rally.
//52WH is at november 18$. Expect a gamma squeeze?
position based on probabilities. I never make targets (future is unknown).
🥂
CLSKThe stock shows upside potential (~40% to Target2) with strong support at $10-$11, but low volume and near-term volatility require caution. Optimal strategy: Enter near support levels, enforce strict stop loss, and track confirmation signals for bullish momentum.
Entry Zone: $10 - $11 (optimal buying area).
Stop Loss: $8.40 (critical level, mentioned twice).
Targets:
Target1: $14.09 - $14.31 (~17-19% upside from entry).
Target2: $15.34 - $16.19 (~40-45% upside from entry)
CLSK / 4hNASDAQ:CLSK has extended an impulse since last week, that's gone beyond the May high >> 11.04. That may be just an initial advance of the anticipated impulsive wave iii(circled).
So, the correction in Minute degree wave ii(circled) could be thoroughly over at 8.43. And an impulsive & same degree wave iii(circled) should have begun its way up.
Trend Analysis >> The trend has turned upward in an impulsive third wave towards the anticipated target.
The first Fib extension target >> 20.06
#CryptoStocks #CLSK #BTCMining #Bitcoin #BTC
CLSK / 2hNASDAQ:CLSK may have ended the impulse in wave c of an expanded flat in wave (x) at 10.83 today.
Wave Analysis >> The retracement in impulse c of the flat correction in (x) may have ended at 10.83 today, and the anticipated following decline of 26% will soon develop a three-wave sequence as wave (y) to conclude the entire correction in wave ii(circled).
The retracing down target >> 7.93
Trend Analysis >> After the conclusion of the entire correction in the Minute degree wave ii(circled), the trend will turn upward soon to an impulsive third wave in the same degree.
#CryptoStocks #CLSK #BTCMining #Bitcoin #BTC
CLSK / 2hAccording to the prior analysis, NASDAQ:CLSK continued to retrace up by 5.5% today, as expected.
Wave Analysis >> The retracement in impulse c of the flat correction in (x) may have ended at 10.74 today, and the anticipated following decline of 25% will soon develop a three-wave sequence abc as wave (y) to conclude the entire correction in ongoing wave ii(circled).
The retracing down target >> 7.93
Trend Analysis >> After the conclusion of the entire correction in the Minute degree wave ii(circled), the trend will turn upward soon to an impulsive third wave in the same degree.
#CryptoStocks #CLSK #BTCMining #Bitcoin #BTC
CLSK Finally Ready for a strong move up?Price printed a textbook motif wave 1 and ABC wave 2 correction ending at the 61.8 Fibonacci retracement golden pocket and High Volume Node (HVN) major support.
Price continues to flirt with weekly 200EMA and looks ready for another test as resistance on the local chart.
The weekly pivot still looms above but if price is in a macro wave 3 we should punch through these resistances over the next few weeks and head towards long term target of $80.
Wave 2 can extend all the way $1.80 before invalidation, though the lower prices goes, the lower the probability of the analysis being correct
Safe trading
CLSK / 2hAs expected, NASDAQ:CLSK has retraced up today, but also unfolding a flat correction of a larger degree in wave (x), which could have remained in progress and at a very late stage now.
Wave Analysis >> After completion of the retracement up in wave c, it's anticipated the following decline of 24% will develop a three-wave sequence abc as wave (y) to conclude the entire correction in wave ii(circled).
The retracing down target >> 7.93
Trend Analysis >> After the conclusion of the entire correction in the Minute degree wave ii(circled), the trend will turn upward to an impulsive third wave in the same degree.
#CryptoStocks #CLSK #BTCMining #Bitcoin #BTC
CLSK / 2hNASDAQ:CLSK had a 6% intraday decline today, completing the second wave of an expanded flat correction in wave b upward.
Wave Analysis >> The leading expanding diagonal as wave a is correcting up in wave b, which should have remained in the last subdivision upward that 7.4% advance now is left.
The retracing up target remains intact >> 9.51
An impending decline by 17.6% as the last subdivision >> wave c of (y) would lie ahead that finally will conclude the entire correction in Minute degree wave ii(circled).
The retracing down targets >> 7.93 >> 7.84
Trend Analysis >> After the completion of the entire correction in the Minute degree wave ii(circled), the trend will turn upward to an impulsive third wave in the same degree.
#CryptoStocks #CLSK #BTCMining #Bitcoin #BTC
