COST has broke through supportCOST looks pretty solid above this support now. Should have room to run for a 2R gain.
COST trade ideas

Costco ASCENDING TRIANGLEIncreasing lows, equal highs, at least two swings passed = bullish surge towards $254
Also: Kumo Cloud indicators gave us a strong bullish signal on May 16 and the cloud is showing strong support


Good time to buy Costco (COST)Weak buy signal with the red+blue cross underneath the Kumo, and lagging strand is showing consolidation. This typically means "wait for more information" but we are approaching a strong support in the trend channel and momentum is pointing towards a reversal.
I'd keep a stop loss around the 238 level, but even if we unload at 247 that's a solid 3:1 risk to reward ratio.

COST - ABC Completed, Time to retrace? You can see the negative divergence on this chart. Stock been pumping up and momentum is vanishing.
I am shorting from up here, puts 2 weeks out.

New ATH for CostcoNew all time high for Costco. Previous ATH at 45 is now resistance. Price should stay up and keep going
COSTco Double TopShorting the double top, $230 target but I might bail around $235 if I can flip the puts in the next couple of days.

Levels for costcoNeeds to break yellow lines to push higher. Needs to break first blue line to push lower.


$Cost Going DownClear bearish divergence at this top
Previously rejected at 240 area and will do so again
First stop 220 which is the .382 retracement and first strong support level

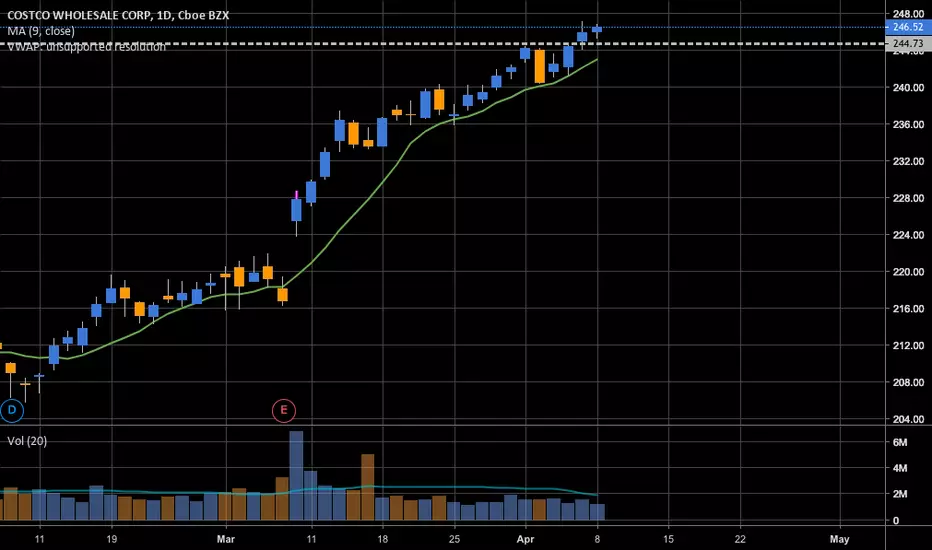
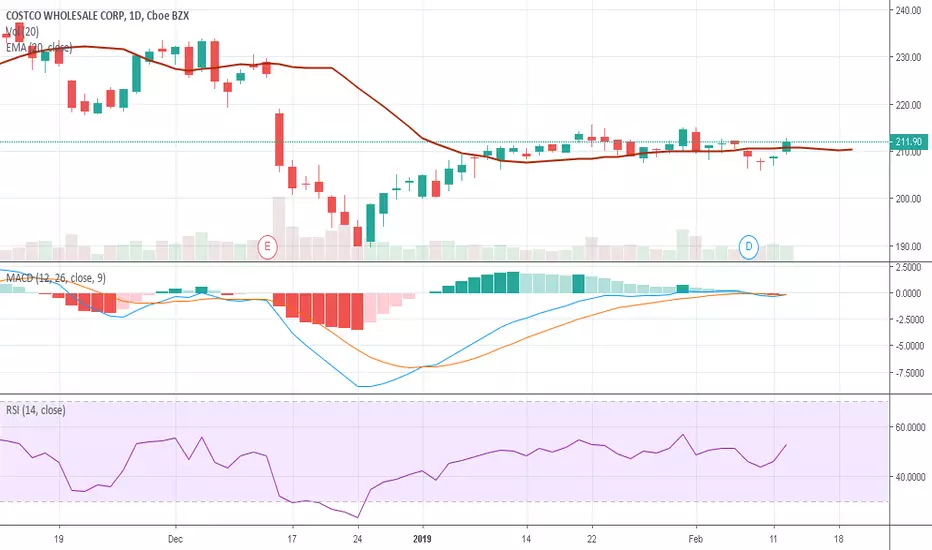
COST: Welcome to CostCo Earnings, I love you!This one was truly a no-brainer for me the other day, but I was waiting to publish on the earnings news. COST is up 5% is afterhours with a potential blowout day tomorrow on market open. I also believe that the financial media will latch onto this good news from them with a fervor in hopes of pushing back a little on this current bear market sell off index wide. I do believe that COST has a possible long run up, but I'll be setting my stops tight until I see upward action for longer than a week. I bought into this a few days ago anticipating that the post-earnings action would be an upward reversion towards a long term mean because even though COST did rise slightly in January, they didn't experience a stellar blowout like some others and I felt that they were due with their holiday shopping earnings report the same as TGT and KSS. I do have profits from TGT and stayed out of KSS because of higher volatility, and it appears the cautious value investor in me made the right decision in this choppy market.
MACD has been floating mildly flatly with only a minor dip today that bounced back of the signal line in after hours activity. The bullish breakout in January wasn't strong enough to pull up the ADX trend strength index above a 20 yet, and I suspected that the +DI would bounce off the -DI as a support in the couple of days leading up into earnings to have a sharp breakout above the 50 and 200 day moving averages as resistance is being tested and the bulls will win have won out on earnings in pre-market. RSI appears to be testing a resistance near 50 as well, but momentum is beginning to look positive and may remain so if the breakout settles into a strong trend channel upward. Money flow is positive, and it looks like the few bears that bet on a bad earnings call are going to get squeezed out fairly quickly for some easy bull trap bait. Volume began to rise right before the call, and will break out hard tomorrow on market open, too.
Welcome to CostCo, I love you!


Looks like a good entry point.Costco is tempting at these prices since it often trades in the 140.00 plus range. Indicators are showing us a good entry, let's see what it can do.

COSTCO, lolDidn't see this yesterday afternoon. Look at the end of day action on the 15 minute chart, obvious short, looks like we missed out.
It's played out already, but man I wish one of my followers or guys I follow posted this one.

COST Costco Wholesale Is Setting Up For A Large ShortCOST recently broke below a major support ($217) as well as below the 200EMA.
I will be looking for short opportunities at the retest of the $217 structure level.

Cost possible scenariosthink we continue down 2moro but just my opinion. Cashed my put at 100% on drop today.

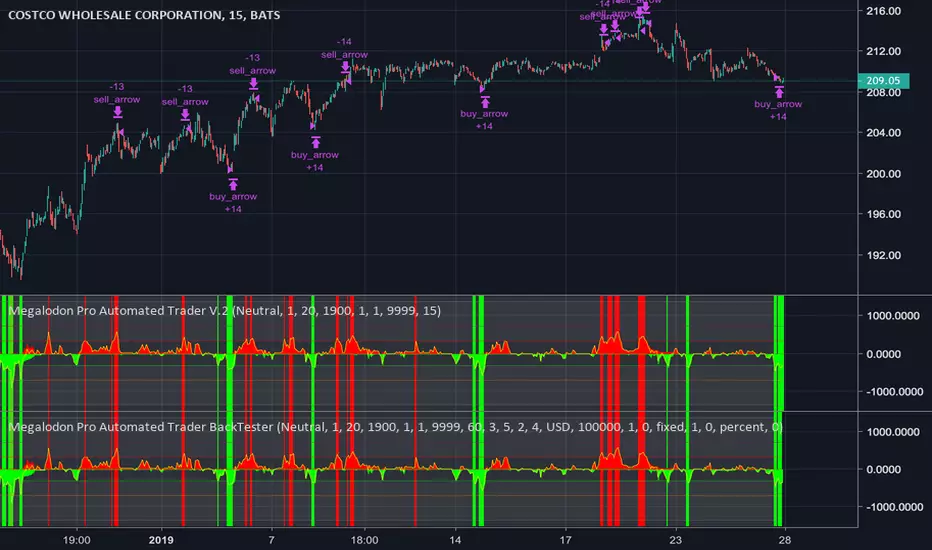
Expect Costco to open on a good noteThe Megalodon Indicators are signifying a strong buy come market open for Costco! This indicator is incredibly accurate! If you'd like to know how to try it out for yourself, just send me a message!

COST appears bear flag at resistanceCOST appears bear flag at resistance. wait for the break of bear flag.

COSTCO... another Amazon's victim? Last reporting data was ok, net sales for the quarter increased 10.8 percent, to $32.28 billion from $29.13 billion last year. Net sales for the first 24 weeks of fiscal 2018 increased 12.0 percent, to $63.40 billion from $56.60 billion last year.
The Company gained an incremental sales day in the quarter due to the shift of Thanksgiving, however pre-Thanksgiving and Black Friday holiday weekend sales fell in the first quarter this year, versus the second quarter last year. This negatively impacted this year’s second quarter sales by approximately 1.4% in the U.S., and slightly less worldwide and negatively impacted E-commerce sales by approximately 7-8%.
However, my expectation for COST is around $220.00, even after rose $170 per share at the end of 2018.
Have a Good Trading Week,
Learn how to beat the market as Professional Trader with an ex-insider!
Cream Live Trading, Best Regards!
