CRM trade ideas

crm shortcup and handle.. 1st support level and tp1 at251. ..252.. 2nd support level and tp2 at 234 ...236

CRM Bearflagging after rejection at top of channel Will likely pullback to 260 next week.
(Not advice, opinion only).

CRM ContinuationCRM broke outside the descending channel and it is setting up for some continuation.
Waiting for entry above 251.25 with targets at 266.40 and ATH

CRM in the way to reach ATHCRM is a market leader and has been breaking earnings for almost a year, this time I think it will reach all-time high again and we'll see how it goes from there.

Trade Idea $CRM #momentumtradeThis is not financial advise
This are trade Ideas
Of stocks that are in a
Momentum set up
Trending upwards

Salesforce Ponzied - Double Top - Large Cap Stonksvaluation matters. Seems to have caught the $doge buzz. Buy Buy Buy. lol
NO.
Profit TODAY matters most in *rising rates environment.

Salesforce Analysis 24.08.2021Hello Traders,
welcome to this free and educational analysis.
I am going to explain where I think this asset is going to go over the next days/weeks and where I would look for trading opportunities.
If you have any questions or suggestions which asset I should analyse tomorrow, please leave a comment below.
I would also appreciate, if you would smash that like button and help me to create more free analysis like that.
Thank you for watching and I will see you tomorrow!

CRM active setup. Let's see how this performsToday we will talk about CRM. Here we have an active setup, and we will explain why we decided to develop it this way.
Main structure: The most important aspect of the chart before the entry was executed, was this huge Flag pattern above a dynamic support resistance level. We were waiting for a breakout of the structure before developing setups. Also, we could observe 0 resistance levels after that.
Time Horizon: When you are trading a big structure, you must understand that these types of setups take a lot of time to evolve. However, that's not a problem if you know how to handle your anxiety and have other setups or strategies running with this.
The target: Is a convergence between fibo extensions and an ascending channel that is not defined yet (we need a new ATH to confirm it. However, if that happens, the alignment is pretty good.
Activation Level: Our entry price is always above minor resistance zones of the corrective pattern, or in other words, "Always above B." That way, we avoid a lot of fakeouts.
Invalidation Level: IF everything goes wrong, the invalidation level we have is below the structure. There we will automatically close our setup losing 1.5% of our Capital.
Thanks for reading!

Update: Salesforce.com Inc: - Take Profit HereThe share is trading in the upper end of my 'take profit' zone (now at $261). Not a fast mover, but target range has been hit. Earnings due Wednesday however I would consider banking here, to avoid 'event risk'.
Original idea attached.

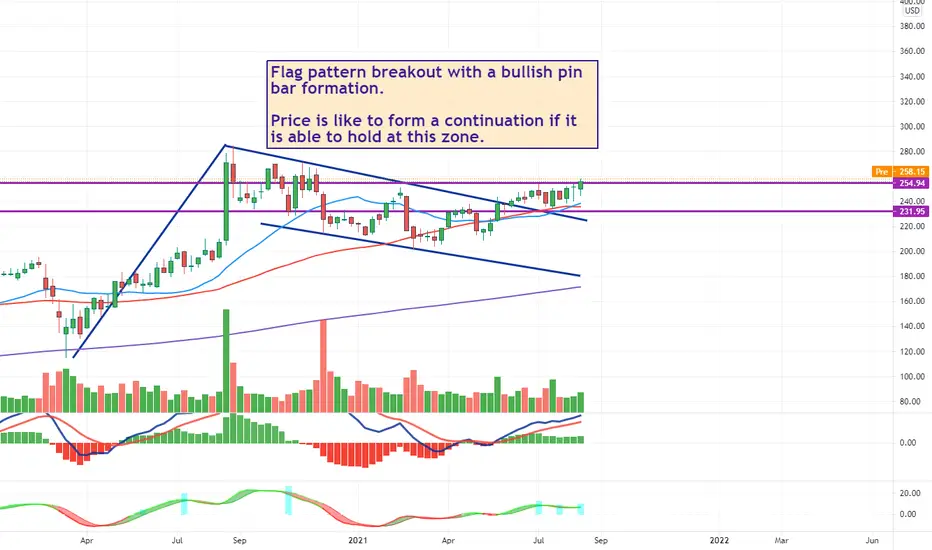
Salesforce.com (CRM - NYSE)Flag pattern breakout with a bullish pin bar formation.
Price is like to form a continuation if it is able to hold at this zone.
CRM 20-07-2021 LongAsset and Time frame -CRM,1D
Entry Price -240.41
Exit(Stop Loss) -235.52
Exit(Take Profit) -256.15
Technical Analysis -Price has been going upwards in a daily trend line channel, price reacted strongly to the median line with a hammer and now confirmation candle(when the candle close), volume has been picking up the last few days.

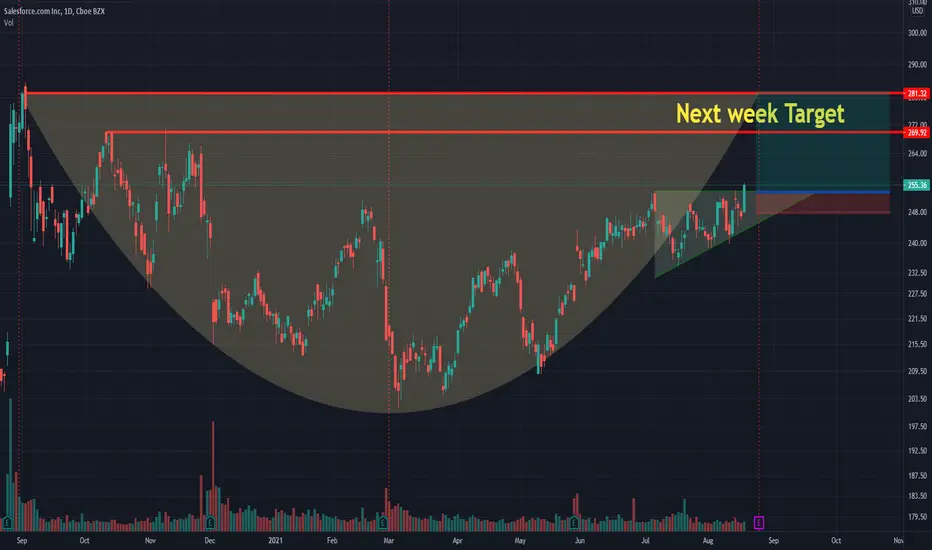
Next week targetEntry: 253-255
Stop loss: 244
Reward/Risk:5
Target range: 280-300
Time Frame: 1-2wks
Possible gain: 11.2(20% for second target)
Possible loss: 2.2%
CRM: Could be breaking out of the consolidation soon!Price broke out of a down channel back in beginning of May, and it went into a consolidation for coming to 2 months.
CRM will be reporting their Earnings on 25th, and price could gap up.
Stop loss can be placed below $237 .
Target will be at $270.
Disclaimer: I'm not giving any trading and investing advice. I'm just sharing my chart observations.
If you have any symbols that you'd like me to analyze, feel free to drop me a comment.


VCP Pattern ,Accumulation and Long, BreakoutSimilar pattern from Mark Miervini's book
Rules of VCP
* Volatality to contract from left to right.
* Stock Going from greater volatility on left side of the price base to lesser volatility on the right base.
* Each successive contraction contained to about half (plus or minus a reasonable amoiunt) of the previous pull back or
contraction. CRM 's Contraction T1 20% T2 is 12.18% T3 6.78 % T4 3.70 % T4 still active 2 days 23 hrs left at the time
of writing
* The volatility measured high to low. Small RED volumn bar Big Green Volumn. Volatility decreasing. Selling Activity Dried up.

CRM Earnings Runup + EW-Earnings coming up for CRM, and currently rolling up for a potential wave 5 move
-MACD turning bullish
-Potential long trade idea on the breakout of consolidation or bounce off consolidation support
-Price targets: 256 / 263
-Exit BEFORE earnings regardless of whether price target met or not
-Trade confirmation: MACD stays bullish, 9EMA stays over 21EMA, volume validating move out of consolidation


Minervini VCP PatternPerfect volatility contraction pattern breakout on watch.
The price has been consolidating for several months. The break over 250 should result up trend with target prices of major pivots above. Entry on break of 250 with volume or, retest of the break.


CRM might be breaking out soonCRM has been breaking out downtrending on 4hr chart for a while now. It is trading above both 50 and 180 Moving Averages. CRM has gotten itself in a wedge, making higher lows and lower highs at the same time. If CRM Price Action could break the resistance of the wedge at $253, there is upside in long term to previous ATH at $267. MACD is on positive side and RSI 70. Needs a big volume for this breakout.

CRMPositive price action on CRM but needs to take out RSI 61.8 level which has been problem in the past. Otherwise, momentum is strong.

Inverse Head and ShouldersTargets 1 listed above. Targets 2 also listed in smaller type and are longer term targets. There is a wide rising wedge that may be narrowing but it is not a super narrow convergence of the 2 trendlines. Just something to keep an eye on for now. Negative volume does appear to be picking up. Price is inside the bands set on an 80 DMA. CRM is not oversold or overbought at this time of RSI set on 80 and 30. CRM traded in a shark pattern at the bottom and pulled to the .886 fib level which has helped it break the neckline.
The Head and Shoulders Bottom, sometimes referred to as an Inverse Head and Shoulders, is a reversal pattern that shares many common characteristics with the Head and Shoulders Top, but relies more heavily on volume patterns for confirmation.
As a major reversal pattern, the Head and Shoulders Bottom forms after a downtrend, with its completion marking a change in trend. The pattern contains three successive troughs with the middle trough (head) being the deepest and the two outside troughs (shoulders) being shallower. Ideally, the two shoulders would be equal in height and width. However, the market is not ideal and the RS and LS are rarely exactly the same price. The reaction highs in the middle of the pattern can be connected to form resistance, or a neckline.
The price action that forms the Head and Shoulders Bottom is roughly the same as that which forms the Head and Shoulders Top, but reversed. The role of volume marks the biggest difference between the two. Generally speaking, volume plays a larger role in bottom formations than top formations. While an increase in volume on the neckline breakout for a Head and Shoulders Top is welcomed, it is absolutely required for a bottom. There is a large volume bar marked by yellow star that marks the 2nd break of the neckline after a throwback occurred. The neckline is resistance until broken and then can become support.
This is a reversal pattern so there has to be a preceding downtrend to reverse. While in a downtrend, the left shoulder forms a trough that marks a new reaction low in the current trend. After forming this trough, an advance ensues to complete the formation of the left shoulder. The high of the decline usually remains below any longer trend line, thus keeping the downtrend intact. From the high of the left shoulder, a decline begins that exceeds the previous low and forms the low point of the head. After making a bottom, the high of the subsequent advance forms the second point of the neckline. The decline from the high of the head (neckline) begins to form the right shoulder. This low is always higher than the head, and should be in the vicinity of the the left shoulder. It is considered more bullish if the right shoulder (RS) is higher than the left shoulder (LS). The neckline forms by connecting reaction highs, or the peaks which represent resistance. Depending on the relationship between the two reaction highs, the neckline can slope up, slope down, or be horizontal. The slope of the neckline will affect the pattern's degree of bullishness: an upward slope is more bullish than a downward slope.
The neckline must be broken with an uptrend in place. An expansion of volume is necessary upon break out. Targets are calculated using the length from the head to the neckline and projected up from the neckline. Any pattern can fail and throwbacks below neckline after a break out do happen. This pattern does well in a bull market and not so great in a bear market.
No recommendation. The green triangles are pocket pivots.
