CRSP/N trade ideas


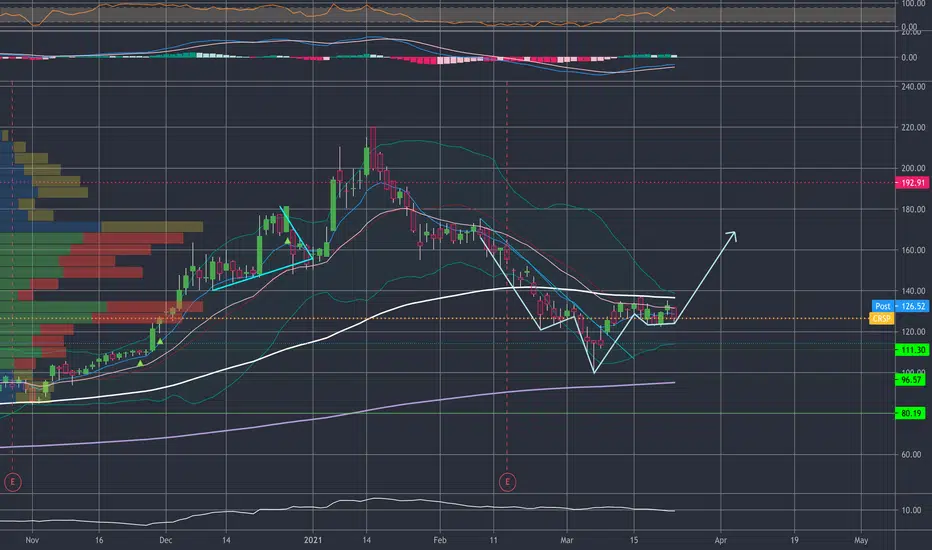
Probable PathSupported at the long term trendline and 200MA. Forming a triangle right now, hoping for a breakout on the long side.

CRISPER, longer term trade. 50% upside Genomic hype has reached its peak almost 3 months ago
(I remember all these youtube channels saying CRSP FUTURE BUY, around + $200. Obviously not everyone can win and was a top)
Now that a significant retracement has happened a reversal is inbound
Weekly chart
TD 9 (incomplete however)
Weekly 50MA support bounce
Head and shoulder top revesal at prior peak, with target of $100 reached, may be ripe for a reversal
Within a 2 month timeframe we may see prices of around $170 - Great for buying options Imo
Happy trading.

CRSP - Ripe for ReboundLooks like Nasdaq is done correcting and looking up now as many stocks have corrected far enough and hit major supports.
One example here is CRSP. It had formed a head & shoulders earlier which followed thru all the way to hit just $2 shy of its H&S target at 98 on 5 March. Bounced and then retested close to this support zone (which comprised both the H&S target and the 61.8% fib retracement of it's entire AB swing up).
Time to accumuate. with initial stop loss slight below it's recent swing low 106. Trail profits up.
Disclaimer: This is just my own analysis and opinion for discussion and is not a trade advice. Kindly do your own due diligence and trade according to your own risk tolerance. Thank you. Feel free to give me your thoughts ! :)

CRSP - BottomingThis stock tends to form double-bottoms months apart. I'm projecting a 2nd pullback to give us our second bottom. This stock has has a very strong year and when it bottoms it bounces are hard and fast. To boot: it's a Swiss company wish gives you a bit of hedging against the dollar. Keep on your watchlist. Cheers!

$CRSP - IHS looks goodCRSP has better IHS than edit but no unusual call option buying.
Watching until we are above and holding 50 SMA.
CRISPR THERAP. - Buy on daily chart - target 182 $Dear traders and followers
the CRISPR stock price closed above the down trend line and formed an inverse head and shoulder pattern on the daily chart. Market is within an strong up trend and reversed several times from 120 $ area. We're looking for a market buy on Monday because this stock could reach the target within a short time frame.
Feel free to leave a comment or to share your ideas in the comments section
Please hit the like button if you share or like this idea.
Follow us and stay up to date/ don't miss new ideas
Thanks for your support!

CRSP - PRICE MOVING TO WAVE 5CRSP price should have completed its wave 4 correction with zig-zag ABC correction pattern, and the prices are corrected to around 61.8% FIBO level of entire wave 3 length correction.
Price is currently moving towards wave 5, and the ballpark target for wave 5 is USD258.
Happy trading!


$CRSP Wave 4 potentially completed and Wave 5 underway.Charting at a friend's request.
On the weekly chart, $CRSP looks to have potentially completed a strong Wave 4 correction.
Sure does feel like its a good time to enter with a position and prepare for a Wave 5 climb, with a potential target price of $281~$319.

good setup in CRSPI like this setup for a bounce to the 160-170 area. After a big sell-off, potential trend support, and the sequential lines up great.

CRSPCRSP may have found support here or it could dip down into green zone- all the way down to 69 but IMH it'll reverse after it's done accumulating. It should make ATHs again. Not financial advice. DYOR

Long term Go Long on $CRSP CRISPR TherapeuticsCurrently, I'm holding $CRSP and have added more today on this 200 moving average support and wedge breakout.


CRSP, REVERSAL COMING?Hello fellow traders and investors, here's another trade idea.
CRSP has recently pulled back to the support area, if CRSP makes a full recovery it offers a 90% ROI.
Technicals:
The Macd indicates that CRSP is oversold
The Macd indicates that CRSP is in a downtrend
The Ema's indicate that CRSP is still in a downtrend
When To Buy:
When EMA's crossover
When the Macd indicates a reversal by crossing its EMA
When To Sell:
I recommend selling at the previous high which offers a 90% ROI.
I anticipate CRSP to consolidate in its support zone and when the Macd and EMA's indicate a reversal then consider buying some shares if it meets your criteria.
NOTE: I personally don't like to buy therapeutics companies stock because of the volatility some of the stocks tend to experience.
I hope you enjoyed this quick analysis and many more to come.
If you enjoyed leave a like and follow, Thanks.

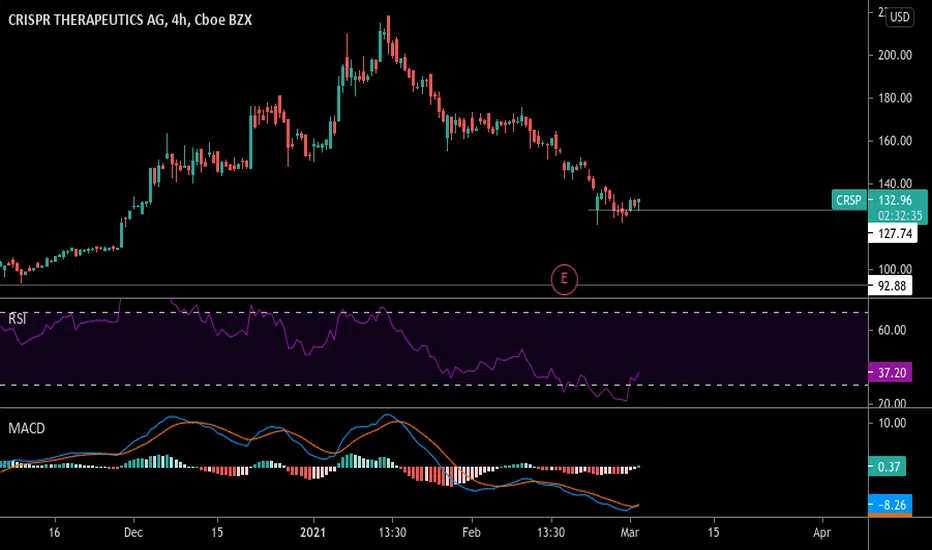
CRSP Possible reversal area with price targetsWhile it has been in a strong downtrend over the past few weeks, CRSP is showing signs of a possible bullish trend reversal.
The 4h MACD is showing triple class A bullish divergence, with a daily bullish hammer candle on top of a critical support area which also lies at the bullish .886 Fibonacci retrace area.
If price-action shows a reversal upwards, the price targets would lie at the .618 Fibonacci retrace (aligning with the shoulders of an old head&shoulders pattern), the .718 Fibonacci retrace (A potential bearish value area), and the all-time high at the 100% Fibonacci retrace level.
The stop loss lies just below the critical support area, however, one should be aware of false breakouts below this level.

The scary truth So as many people are thinking of stocks they wished they could’ve bought into earlier this one popped up in my head! Now... I’ve seen this with a lot of stocks I wanted to buy but they ran too much.. from its high it’s down almost 50% awesome right... but look at the chart when you zoom out... these stocks can fall so so much more... I am becoming more and more bearish

CRSP short trade updates on weekly chartHere is my follow up update on original CRSP swing short trade idea I put up on January 14th.
On this post, I am zooming out to weekly chart, looking at longer time frame to capture cyclical trends.
Going back all the way to 2017 inception period, the higher than average volatilities are pretty easy to notice. It moves up really fast but also coming down. Every single time it has entered bear market or the sell signal is triggered, it has corrected well into double digit, easily averaging over 50%. In addition, RSI being overbought and high level PPO bearish cross overs are clear indication to trend reversal as well.
Lastly, the week is too young still to comment yet but as of the end of today's session, it has taken down the up trend line as well on the weekly chart. There are plenty of time left in the week to recover the trend line but we shall see. It would be bullish if it can snap back above by the end of this week. I do not think CRSP will drop to my potential max targets without decent double digit correction in SPY and QQQ.
I will comment on this post after the Friday close to see where it will be by then.
If anyone has any thoughts either bullish or bearish, I would love to hear from you. Also, if you find it interesting, please follow me here.
Have a good trade everyone,
T.


Getting close to entry pointOne of my favorites and i never thought it will come down these prices. I bought it at a higher prices but this one is a long term hold.


breakout backtest and Mac D CrossSTrong long setup from very oversold levels, bounce can be very strong