CVE/N trade ideas

CVE BullishCVE energy
good buying opportunity
price undervalued and at both weekly and daily demand
seasonality coming to bullish
Trade Safe

Cenovus Energy (CVE) 2h.Based on my analysis, Cenovus Energy (CVE) presents a solid buying opportunity.
A stop is set at 23.20 to manage risk, with a target price of 24.30, offering a favorable potential for gains

CVE - Clear Structural Changemanually stop with daily close under the line
I am an amateur trader. I sometimes enter into trades. Other times it is only an analysis. Trade with your own risk awareness.

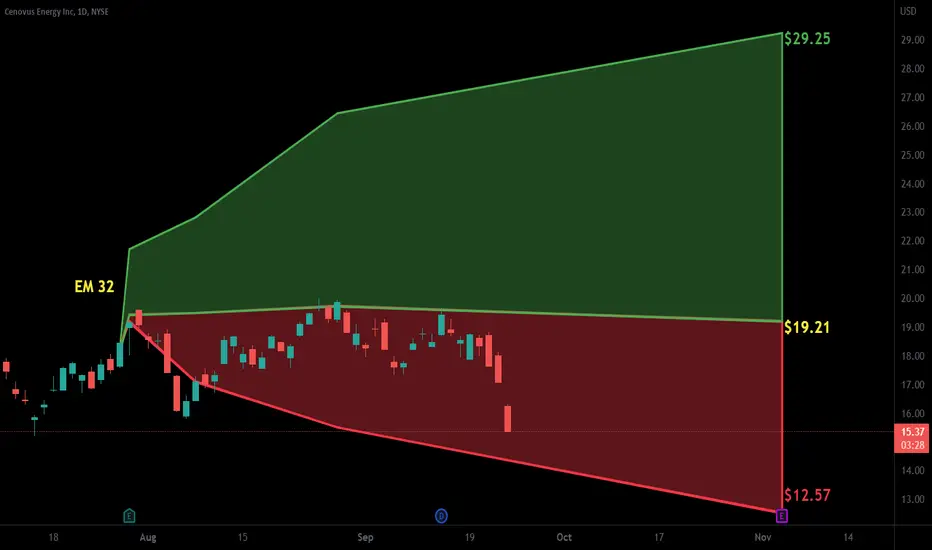
Cenovus Energy - Bullish Flag Pattern Formation in HT*Cenovus Energy CMP - $19.90*
Buy Range $19 - $20 ONLY
Target 1 - $25
Target 2 - $30
Target 3 - $35 / 40+
Disclaimer: This is my view and for educational purpose only.

CVE shortChart analysis leads me to believe that shorting CVE is a good option here. I would definitely buy the dip at around 1.40 - 1.60 though. We'll see what happens.

CVE BUYHi, according to my analysis. CVE stock. There is a very good buying opportunity as the stock has broken the downward trend. It also breached the sideways channel and the resistance at level 24. good luck for everbody

Cenovus Energy Inc. oilCVE stock on the 3Day time frame.
-Looks like a double top to me
-I am bearish to neutral on CVE
-48MA turning down, if the 13MA crosses also I'd be more bearish
-Highly dependant on Oil price but when main market sells off its a double wammy
None of this should be interpreted as financial advice, I am not a professional or certified financial adviser! all charts, and or analysis' are my personal opinions and observations only!

$CVE with a Bullish outlook following its earnings #Stocks The PEAD projected a Bullish outlook for $CVE after a Negative over reaction following its earnings release placing the stock in drift C with an expected accuracy of 100%.

Cenovus Energy INC.CVE price chart analysis on the 3Day time frame 2015-Current.
In line with my "Keep it simple stupid" philosophy, my trend analysis shows that when the 13 SMA crosses the 48 SMA, it is a notable occurrence, possibly indicating a change in trend upcoming. My buy or sell decision occurs when the red 48 SMA turns down (Bear) or up (Bull). This simple strategy shows me possible % gains if playing various long or short market equity instruments and entering/exiting the trade near or at these occurrences. Included is the 200 SMA line.
My method of trading this ticker is to buy or short 100% of my position at the 13/48 SMA crosses (with 48 pivoting up or down) This helps my probability of success and risk factor. Using this method and resulting in 8 trades short and long, I could possibly have made around 75% gain on the downside since 2015, and an additional approx. 400% gain on the long side since Jan. 2021 had I been selling at these level. Normally I would be still holding the position until a new 13/48 SMA cross down (so return would be less). The support line is included around $14/sh mark for interests sake, as price would most likely bounce around there for a bit imo.
I could also add other indicators such as custom buy sell signals and or MACD, RSI, SAR to assist my decision making but the trend based idea keeps me grounded in the trade.
I generally use Heikin-Ashi candles for simplicity/clarity and also remove the wicks.
None of this should be interpreted as financial advice, I am not a professional or certified financial adviser! all charts, and or analysis' are my personal opinions and observations only!

$CVE with a Bullish outlook following its earnings #Stocks The PEAD projected a Bullish outlook for $CVE after a Positive Under reaction following its earnings release placing the stock in drift A with an expected accuracy of 70%.
Cenovus Energy Moving Back UpCenovus Energy has had a bit of a run after reporting higher Q2 EPS year over year.
They are also potentially getting a bit of a bump pre next weeks OPEC meeting with crude oil closing higher on Friday even as recession concerns continue as traders see little prospect of a rise in supply coming from next week's OPEC+ meeting.
Might be worth a watch.

US Stock In Play: $CVE$CVE - Energy | Oil & Gas Integrated
blow out quarter from ER yday, posting a record EPS of +0.92 (YoY +940%), and highest sales revenue of 12.95B (YoY +52%)
cleared AVWAP from ATH with imminent golden cross from short term MAs (10v20). a trajectory to resumption of its uptrend

Buy CVE in US stock market 26/7/2022You can buy it Target 18.75 and 20.59 stop loss 15.74 money management is your responsibility I recommend entering a maximum of 10% of the portfolio. good luck

CVE , Countertrend , SHORTThis looks like a trade to me , which I entered moments before close was actually looking at MRO as another choice but I like the way this one closed more from a risk to reward setup basis.
**** Countertrend ****, so low probability, but price action gives us some hints of a short term reversal move here I'm looking for :
1) gap up that was not enthusiastically held by bulls ,
2) borderline overextended here from MA's
3) Doji/starish price action increases likelihood of reversal continuation , hints bulls are running out of steam at this price level and
probably taking some profits .
Entry: 23.14
Stop : 24.01
PT 1 :22.35 ( sell 1/4) this is 1R
PT 2 :is 2R ( sell another 1/4 here )
Balance will try to run, if possible...
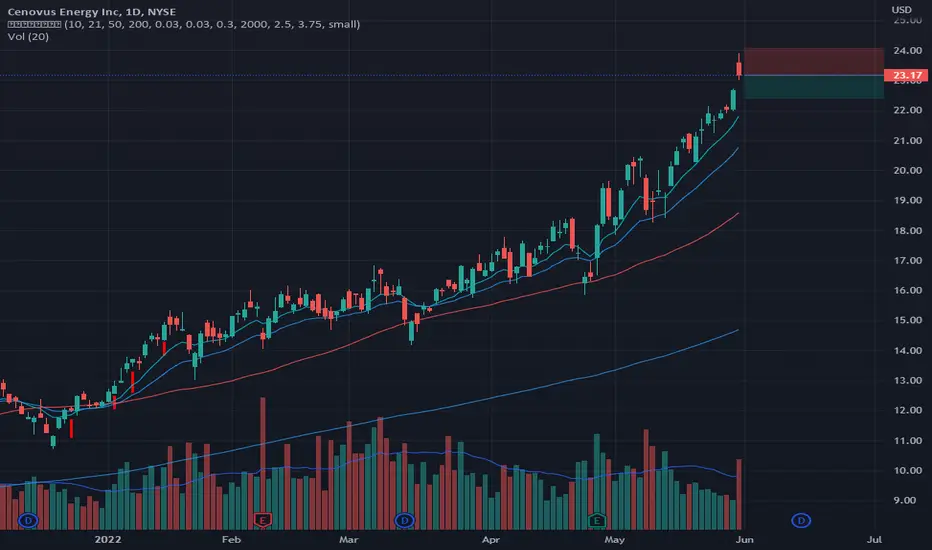
New Swing : CVEFollowing positive earnings, these are my personal levels swinging with EMA 21 and 50 onthe hourly chart
Long any price above 18.54
Short any price below 15.70
Will take profit in 3 steps letting the last stake to go.

Go for glory, why notwow this has been invincibly bullish. If we flip the Value Area High into support there's no reason why we can't head to the top.


CVE longCVE entry to ride the train up to the 786. 1st leg from pullback to 382 completed. Missed the break of the lower diagonal trend line. Expected a bigger pullback here but did not get it, break of line at 14.89 gave an entry signal on the 1 hour. Usual stop loss management of weekly and daily 50:50.

Cenovus $15 targetI see no reasons why this won't go back to test 2018 highs of 14.84 and go beyond that into the end of the year.
Positive macro around oil and canadian producers right now
Lots of calls for $90 even $100 wti from goldman sachs
2018 WTI made a high of $76 before getting slaughtered all of 2019. I believe this time around we have the inverse scenario.

$CVE - Trailing WTICVE is currently fighting with the top of the 5 year price channel.
WTI has clearly broken out of the previous 5 year price pattern, CVE is lagging.
Earnings on Nov 2 - I'm looking for a big breakout there.
After breaking out of the existing channel, the new range might be $15-$22 (CDN)

CVE (TSX) slows down bullish trendCVE had a quick uptrend, mainly for oil and gas surprises. While CVE diversified its resources for energy, it may face slower growth in its up-trend. It will move toward $14.5 but stall between 14.30 and 14.5 for a while in a very optimistic hope. After earning, it may jump toward $15.
However, the price may surprise us toward higher numbers as high as $22, which is colinear with the oil price in the $100 level.

Cenovus EnergySetup
Entry: Closing price above 8.60$
Stop: 8.10$
Target: 10.60$
Risk-Reward-Ratio: > 4:1
