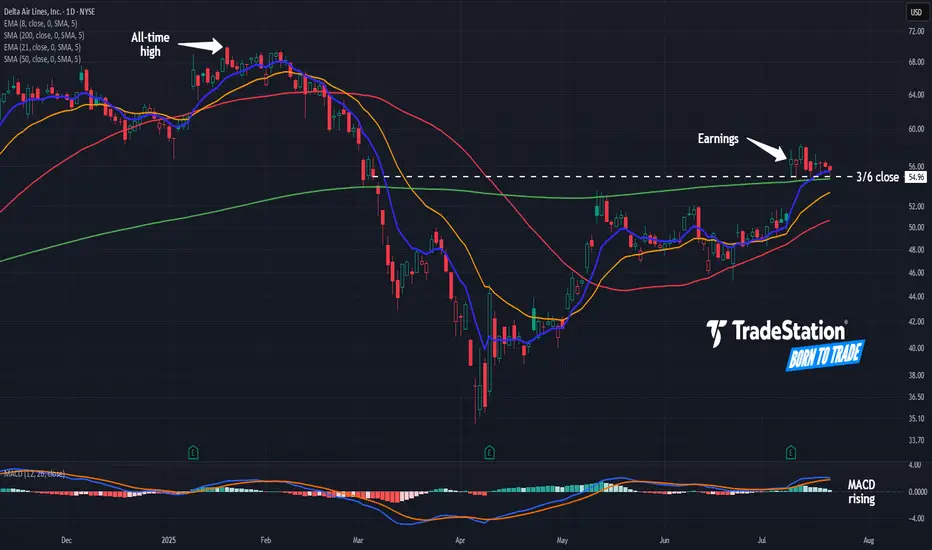
Delta Airlines: Where’s the Pullback?Delta Airlines rallied two weeks ago on strong earnings, and some traders may see further upside.
The first pattern on today’s chart is the tight consolidation pattern since July 10. The lack of pullback could reflect a lack of selling pressure in the transport stock.
Second, DAL has remained above the March 6 closing price of $54.96 and its 200-day simple moving average. Has new support been established above the pre-earnings highs?
Third, the 8-day exponential moving average (EMA) is above the 21-day EMA. MACD is also rising. Those signals may be consistent with short-term bullishness.
TradeStation has, for decades, advanced the trading industry, providing access to stocks, options and futures. If you're born to trade, we could be for you. See our Overview for more.
Past performance, whether actual or indicated by historical tests of strategies, is no guarantee of future performance or success. There is a possibility that you may sustain a loss equal to or greater than your entire investment regardless of which asset class you trade (equities, options or futures); therefore, you should not invest or risk money that you cannot afford to lose. Online trading is not suitable for all investors. View the document titled Characteristics and Risks of Standardized Options at www.TradeStation.com . Before trading any asset class, customers must read the relevant risk disclosure statements on www.TradeStation.com . System access and trade placement and execution may be delayed or fail due to market volatility and volume, quote delays, system and software errors, Internet traffic, outages and other factors.
Securities and futures trading is offered to self-directed customers by TradeStation Securities, Inc., a broker-dealer registered with the Securities and Exchange Commission and a futures commission merchant licensed with the Commodity Futures Trading Commission). TradeStation Securities is a member of the Financial Industry Regulatory Authority, the National Futures Association, and a number of exchanges.
TradeStation Securities, Inc. and TradeStation Technologies, Inc. are each wholly owned subsidiaries of TradeStation Group, Inc., both operating, and providing products and services, under the TradeStation brand and trademark. When applying for, or purchasing, accounts, subscriptions, products and services, it is important that you know which company you will be dealing with. Visit www.TradeStation.com for further important information explaining what this means.
DAL trade ideas
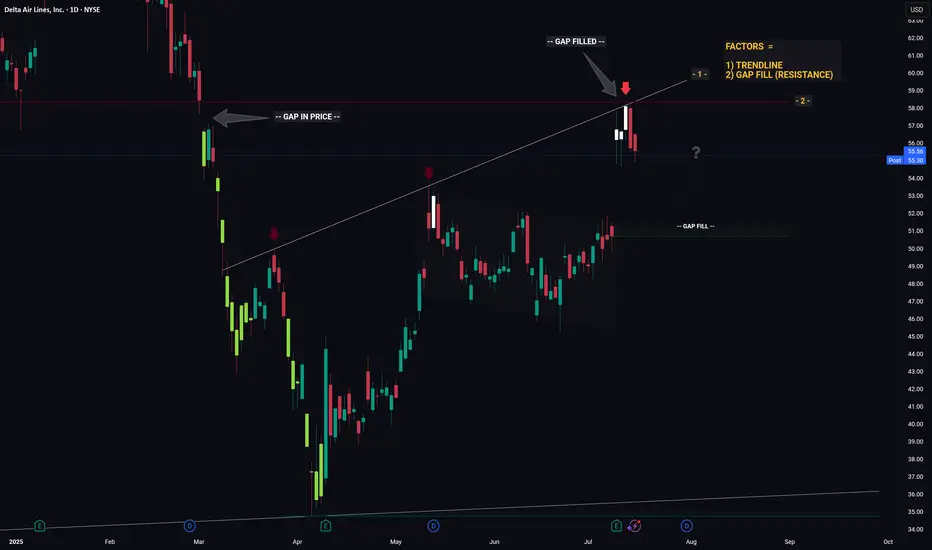
DELTA - Converging Levels Creates Huge Resistance - Retrace?Hello Traders!
Whichever Hedge Fund that is responsible for the recent price action in DELTA mustve been in a generous mood... because theyre giving us an excellent hint as to what price will likely do next.
And what hint might that be you ask...
1) Trendline (connecting the recent highs)
2) Gap Fill (Resistance)
Individually these factors are relatively strong, however when combined they essesntially create a strong barrier that will be very hard for price to break through. Think about it like a wall made from Captain Americas shield... now try and break through that.. aint gonna be easy.
So whats next for price? If I was a betting man (and I am, incase you were wondering) I would say theres a high probability that price is going to trade down from this resistance level then retrace to the gap fill below. From the gap fill level we will likely see a bounce.
Thanks, I hope you found this post educational or helpful and best of luck on your trading journey!
Delta Air Lines, Inc. (DAL) on the verge of testing resistanceAs shown in the chart studies, premarket trading for the DAL stock indicates that price is trading 10% in the green, breaking through key resistances at the 3M level of US$51.80. Overhead, attention will now be on two barriers of resistance: the 1M level at US$57.51 and the 3M base at US$60.16.
FP Markets Research Team

$DAL Iron Condor Trade expiring 7/18 (36 days)NYSE:DAL
+1 $60 call 7/18
-1 $57.5 call 7/18
{current share price: ~$49]
-1 $42 put 7/18
+ $42 put 7/18
Credit (as of 6/12 close): ~$50
Collateral: $250
Risk:Reward = 4:1

Delta Air Lines: Potential BreakoutDelta Air Lines has squeezed into a tight range, and some traders may think it’s breaking out.
The first pattern on today’s chart is the series of lower highs since May 13. DAL closed above that falling trend line last Friday, which could mean the resistance has been overcome.
The move resulted in a bullish outside week, immediately after a bullish inside week. That’s potentially consistent with prices consolidating before moving again.
Bollinger Band Width compression in the lower study may substantiate that view. (Notice the potential volatility squeeze taking shape.)
Next, the airline held a 50 percent retracement of its surge between April 30 and May 12. Does that suggest movement is pointing higher?
Finally, the 8-day exponential moving average (EMA) has stayed above the 21-day EMA. That may also be consistent with a short-term uptrend.
Check out TradingView's The Leap competition sponsored by TradeStation.
TradeStation has, for decades, advanced the trading industry, providing access to stocks, options and futures. If you're born to trade, we could be for you. See our Overview for more.
Past performance, whether actual or indicated by historical tests of strategies, is no guarantee of future performance or success. There is a possibility that you may sustain a loss equal to or greater than your entire investment regardless of which asset class you trade (equities, options or futures); therefore, you should not invest or risk money that you cannot afford to lose. Online trading is not suitable for all investors. View the document titled Characteristics and Risks of Standardized Options at www.TradeStation.com . Before trading any asset class, customers must read the relevant risk disclosure statements on www.TradeStation.com . System access and trade placement and execution may be delayed or fail due to market volatility and volume, quote delays, system and software errors, Internet traffic, outages and other factors.
Securities and futures trading is offered to self-directed customers by TradeStation Securities, Inc., a broker-dealer registered with the Securities and Exchange Commission and a futures commission merchant licensed with the Commodity Futures Trading Commission). TradeStation Securities is a member of the Financial Industry Regulatory Authority, the National Futures Association, and a number of exchanges.
TradeStation Securities, Inc. and TradeStation Technologies, Inc. are each wholly owned subsidiaries of TradeStation Group, Inc., both operating, and providing products and services, under the TradeStation brand and trademark. When applying for, or purchasing, accounts, subscriptions, products and services, it is important that you know which company you will be dealing with. Visit www.TradeStation.com for further important information explaining what this means.

Delta Airlines - Long Term FlyerHey, all. Pretty intense idea here, but I am a buyer of NYSE:DAL at these levels. Obviously, the chart looks awful from a recent performance perspective. However, if you take a long term view, we could actually be rebalancing after an initial range expansion to the upside. Just like NASDAQ:RIVN , airlines are/have been a pretty brutal investment. I guess I have a thing for pain. Ha.
I am certainly a believer that airlines are undervalued here and can reverse back to the upside. Of course, it goes against the current narrative that the economy is showing signs of weakness. But I am just willing to take the risk on this one. I believe the consumer and culture shift in the US to have more experiences in life will continue to hold.
Are we going to come in for a hard landing, or take off to cruising altitude? We'll see what kind of lift the market will give us. Right now the turbulence is pretty intense.

DAL watch $48.5x: Key Resistance might give us a Dip BuyDAL and airline sector has been flying (lol)
Currently testing a DoubleFib Resistance.
We should see a dip soon for possible buys.
$ 48.43 - 48.54 is the resistance to watch.
$ 46.70 is the first good support of interest.
$ 45.29 is a MUST Hold or bulls are done for.
.
Previous Chart with the Big Picture:
Recent Bottom picking:
================================================
.

DAL WILL PAY US!!!Watching DAL for potential continuation to the downside. Price is still holding under key resistance and failing to reclaim structure. If we see a retracement toward the $40.30–$40.80 zone, I’ll be looking for rejection and confirmation to enter short.
Day trading targets are $39.10, $38.60, and $38.00. All those levels aligned with previous price reactions and areas where liquidity probably is.
Weak follow-through on bounces, so I’m staying bearish unless something changes intraday.

Breaking: Delta Air Lines, Inc. (NYSE: $DAL) Surged 8% TodayShares of Delta Airlines, Inc (NYSE: NYSE:DAL ) surges 8% today after the company reported adjusted earnings per share (EPS) of $0.46 on operating revenue of $14.04 billion. Analysts polled by Visible Alpha had forecast $0.39 and $13.89 billion, respectively.
The company which provides scheduled air transportation for passengers and cargo in the United States and internationally reported passenger revenue per available seat mile (PRASM) of 16.78 cents and cost per available seat mile (CASM) of 19.69 cents; analysts had expected Delta to lose about 2.8 cents per ASM transporting passengers. Delta and domestic rivals United Airlines (UAL), American Airlines (AAL), and Southwest Airlines (LUV) all were profitable but lost money flying passengers in 2024.
Delta said it expects second-quarter revenue to rise or decline by 2% and adjusted EPS from $1.70 to $2.30, below the $2.41 consensus. The airline said it is not affirming or updating full-year projections at this time "given current uncertainty."
Analyst Forecast
According to 14 analysts, the average rating for DAL stock is "Strong Buy." The 12-month stock price forecast is $64.56, which is an increase of 68.30% from the latest price.
Technical Outlook
As of the time of writing, NYSE:DAL shares are up 6.69% trading within a bullish pattern. The asset has more to run as hinted by the RSI at 31. NYSE:DAL 's chart pattern shows a bullish engulfing candlestick and a break above the $45 pivot point could cement the path for a bullish move to the 1-month high.

DAL eyes on $40-41: KEY Double Golden support going way backAirlines have been crashing and DAL has been a leader.
Double Golden zone has been proven over many years.
Golden Genesis at $40.04 and Golden Covid at $41.13.
Ideally we get consolidation within the zone then launch.

DAL watch $48.xx: Double Fibs that need to become strong supportDAL trying to recover after the serious market wide dip.
Currently retesting a tight confluence of Genesis+Covid fibs.
$48.43-48.54 is proven zone of concern that bulls must hold.
====================================================

Watch This Before Trading Delta Airlines Stock in 2025!The Art of Trading: Price Action, Supply and Demand, and Patience in Delta Airlines. Trading in the stock market is a skill that requires a deep understanding of market dynamics, disciplined decision-making, and the ability to remain patient in the face of volatility. Among the most effective strategies for achieving consistent success are price action analysis, supply and demand principles, and meticulous money management. This supply and demand stock analysis will explore how these strategies can be applied to Delta Airlines (DAL), focusing on key price levels, candlestick patterns, and the importance of patience in making informed investment decisions.
A strong demand level for Delta Airlines (DAL) has been identified at $43. This level represents a price zone where buyers have historically shown significant interest, leading to price reversals. By waiting for the stock to retrace to this level, traders can enter positions with a higher probability of success as the likelihood of renewed buying pressure increases.

DAL (Delta Air Lines) – 30-Min Short Trade Setup !📉🚀
🔹 Asset: Delta Air Lines (DAL)
🔹 Timeframe: 30-Min Chart
🔹 Setup Type: Bearish Breakdown Trade
📌 Trade Plan (Short Position)
✅ Entry Zone: Below $46.68 (Breakdown Confirmation)
✅ Stop-Loss (SL): Above $49.14 (Invalidation Level)
🎯 Take Profit Targets:
📌 TP1: $43.71 (First Support Level)
📌 TP2: $40.77 (Extended Bearish Move)
📊 Risk-Reward Ratio Calculation
📉 Risk (SL Distance): $49.14 - $46.68 = $2.46 per unit
📈 Reward to TP1: $46.68 - $43.71 = $2.97 (1:1.21 R/R)
📈 Reward to TP2: $46.68 - $40.77 = $5.91 (1:2.40 R/R)
💡 Favorable Risk-Reward Setup – Targeting a 1:2.40 R/R at TP2.
🔍 Technical Analysis & Strategy
📌 Bearish Descending Triangle Breakdown – Price broke below the trendline, indicating further downside potential.
📌 Weak Buying Pressure – Struggling to hold above $46.68, signaling seller dominance.
📌 Volume Confirmation Needed – A strong sell volume spike below $46.68 confirms momentum shift.
📌 Momentum Shift Expected – Breakdown could lead to $43.71, then extend to $40.77.
📊 Key Resistance & Support Levels
🔴 $49.14 – Stop-Loss / Resistance Level
🟡 $46.68 – Breakdown Level / Short Entry
⚪ $43.71 – First Target / TP1
🟢 $40.77 – Final Target / TP2
📉 Trade Execution & Risk Management
📊 Volume Confirmation – Ensure strong selling pressure before entry.
📉 Trailing Stop Strategy – Move SL to breakeven ($46.68) after hitting TP1 ($43.71).
💰 Partial Profit Booking Strategy:
✔ Take 50% profits at $43.71, let the rest run to $40.77.
✔ Adjust SL to breakeven ($46.68) after TP1 is hit.
⚠️ Fake Breakdown Risk
❌ If price moves back above $46.68, exit early to limit losses.
❌ Wait for a strong bearish candle close below $46.68 before an aggressive entry.
🚀 Final Thoughts
✔ Bearish Setup Confirmed – Breakdown signals further downside potential.
✔ Momentum Shift Expected – Watch for volume confirmation.
✔ Favorable Risk-Reward Ratio – 1:2.40 R/R at TP2 makes this a high-quality trade.
💡 Stick to the plan, manage risk, and trade smart! 📉🔥
🔗 #ProfittoPath 🏆 | #TechnicalAnalysis 📉 | #SmartTrading 💰 | #ShortTrade 📊 | #RiskManagement ⚠️

General Market Ramblings - $BTCUSD, $TSLA, $GDX, $DAL, $BBEUHi, all. Wanted to get something published for the first time in awhile. Unfortunately my mom passed away recently and that has been something I have been going through. It is therapeutic to record something and get it out to you all. I am approaching feature film length on this one, so kudos if you make it through the whole video.
I just wanted to discuss some general market thoughts here - especially as we are now in an interesting time. I hope you do find some value here! Believe me, this really is just scratching the surface of my market thoughts and the different stocks that I have thoughts on. But again, really just wanted to get something out to you guys. Even if you tune in for a minute or two, thanks for watching! It means a lot. Feel free to provide feedback as well of course.
As always, a lot of my thoughts are based on the "Time @ Mode" method that we discuss in the Key Hidden Levels TradingView chat.
Also, as always, these are strictly my thoughts and opinions. I am not a professional and I encourage you to do your own research before making investment/trading decisions. These opinions are not financial advice.
Assets in this video: COINBASE:BTCUSD , COMEX:GC1! , NASDAQ:TSLA , AMEX:GDX , CBOE:BBEU , NYSE:DAL , maybe others I forgot about.

DAL eyes on $57.06: Break and Retest to mark end of DownTrend? Airlines had a nice flight but are now coming in for a landing.
DAL trying to regain altitude but is held down by turbulence.
$ 56.69-57.06 is the exact zone of concern for bulls to break.
=====================================================
.

30 Day 'Jade Lizard' TradeNYSE:DAL
Jade Lizard Trade
Expiration (4/4) just prior to earnings (4/9)
BUY (+1) $66 Call 4/4
SELL (-1) $65 Call 4/4
SELL (-1) $51 Put 4/4
CREDIT = ~$150-$200 as of 3/4 market close
If assigned on short put, break-even on 100 shares will be around $49.25
If the price shoots UP to infinity then your profit is limited to credit received (~$175) minus $100 (debit to close call credit spread at max loss) = $75, (there is NO risk to the upside on a jade lizard, only reduced profit).

DAL Delta Air Lines Options Ahead of EarningsIf you haven`t bought the dip on DAL:
Now analyzing the options chain and the chart patterns of DAL Delta Air Lines prior to the earnings report this week,
I would consider purchasing the 60usd strike price Calls with
an expiration date of 2025-2-21,
for a premium of approximately $3.80.
If these options prove to be profitable prior to the earnings release, I would sell at least half of them.

Delta Airlines (DAL) – Bullish Target AnalysisKey Observations:
Elliott Wave Structure:
The analysis identifies a potential completion of Wave 4, setting the stage for Wave 5.
Price is projected to move towards the key resistance zone near the tip of the arrow.
Target Zone:
Price Target: $79.34
This level aligns with the Elliott Wave 1.00 Fibonacci Extension, indicating a potential bullish breakout.
Support and Momentum:
Support Zone: $56.73–$53.40 (Wave 4 retracement levels).
Momentum remains bullish, as the price sustains its position above key trendlines.
Scenario:
Bullish Scenario:
The price targets $79.34, driven by strong momentum and adherence to the Elliott Wave structure.
Bearish Scenario:
A breach below $56.73 may invalidate the immediate bullish setup, leading to a potential consolidation or pullback.
Conclusion:
Target Price: $79.34
Confidence Level: High (if support levels hold).
📢 Disclaimer:
This analysis is for educational purposes only and does not constitute financial advice. Always perform your own research and consult a financial advisor before trading. 🚨

Delta Air Lines Has Pulled BackDelta Air Lines has been ripping since the summer, and some traders may see an opportunity in its latest pullback.
The first pattern on today’s chart is the gap on November 6 after Donald Trump was confirmed as next U.S. President. DAL retraced that move to hold its election-day high on Wednesday. Has old resistance become new support?
Second, prices are trying to hold the rising 50-day simple moving average (SMA). That may suggest its intermediate-term trend is pointing higher.
Next, the 50-day SMA had a “golden cross” above the 200-day SMA in October. That may suggest its long-term trend has turned bullish.
Finally, stochastics are rebounding from an oversold condition.
TradeStation has, for decades, advanced the trading industry, providing access to stocks, options and futures. If you're born to trade, we could be for you. See our Overview for more.
Past performance, whether actual or indicated by historical tests of strategies, is no guarantee of future performance or success. There is a possibility that you may sustain a loss equal to or greater than your entire investment regardless of which asset class you trade (equities, options or futures); therefore, you should not invest or risk money that you cannot afford to lose. Online trading is not suitable for all investors. View the document titled Characteristics and Risks of Standardized Options at www.TradeStation.com . Before trading any asset class, customers must read the relevant risk disclosure statements on www.TradeStation.com . System access and trade placement and execution may be delayed or fail due to market volatility and volume, quote delays, system and software errors, Internet traffic, outages and other factors.
Securities and futures trading is offered to self-directed customers by TradeStation Securities, Inc., a broker-dealer registered with the Securities and Exchange Commission and a futures commission merchant licensed with the Commodity Futures Trading Commission). TradeStation Securities is a member of the Financial Industry Regulatory Authority, the National Futures Association, and a number of exchanges.
TradeStation Securities, Inc. and TradeStation Technologies, Inc. are each wholly owned subsidiaries of TradeStation Group, Inc., both operating, and providing products and services, under the TradeStation brand and trademark. When applying for, or purchasing, accounts, subscriptions, products and services, it is important that you know which company you will be dealing with. Visit www.TradeStation.com for further important information explaining what this means.

What are we seeing in the technical analysis of $DAL?📊 In the NYSE:DAL chart, we can observe a classic pattern, an uptrend channel. This type of formation starts with an initial movement that sets the tone for the channel, either bullish or bearish. In this case, it's an uptrend channel that is validated when the price respects the structure at least twice.
📈 Over time, we’ve seen that this channel has held. However, the relevance of the pattern depends on the time frame. For example, a channel on daily, weekly, or monthly charts is more significant than one on a one minute chart, which can quickly be invalidated.
🗝️ Key data about the NYSE:DAL channel
▫️ Start 🟰 August 6, 2024.
▫️ Duration 🟰 102 days, about 3 months.
▫️ Movement 🟰 +75% within the channel.
📅 This week, for the first time, the price broke out of the channel, which could signal a pattern change. Here are three key points to consider
▫️ RSI Relative Strength Index🟰 Shows a bearish divergence on daily timeframes and overbought levels.
▫️ Parabolic SAR Indicator 🟰 It’s very close to the price and could shift from an uptrend to a downtrend.
▫️ Pending Gap 🟰 There's a significant gap between $58 and $60 that hasn't been closed yet.
📊 Key fundamental points In Q3 2024, NYSE:DAL reported
▪️ Total Revenue 🟰 $15.6 billion, a year over year growth of 1.2%.
▪️ Operating Margin 🟰 8.8% vs 12.4% in the same period of 2023.
▪️ Net Margin 🟰 Improved from 7.1% to 8.1%, thanks to financial income of fsetting high costs.
▪️ EPS 🟰 $1.50 slightly below the estimate of $1.5.
▪️ Debt 🟰 Delta has significantly reduced its debt, from $26 billion in 2020 to $14.3 billion in Q3 2024, with a Debt/EBIT ratio of 3.3x, much lower than United Airlines (5.59x). This solid financial management suggests that DAL could restart its share buyback program soon.
📊 Outlook
👥 Passengers 🟰 Global traffic is expected to grow by 7% in 2024, with a compound annual growth rate of 5.57% through 2028.
🛫 Valuation 🟰 According to a DCF model, the target price for DAL is $78.60, implying an upside potential of 20% from current levels.
📉 Although technical indicators suggest a potential short term pullback, DAL’s strong fundamentals, its focus on the premium segment, and improvements in its balance sheet are positive signals for the long term.

Pulse of an Asset via Fibonacci: DAL Golden Genesis double top? This Concept is part of my study of Fibonacci Ratios applied to Assets.
This Chart captures the life of Delta Airlines ruled by the Golden Ratio.
This Post is to alert of possible double top and a reason for the last top.
The growth of anything in nature is choreographed by the Golden Ratio.
The growth of value or popularity of an asset is regulated by the same.
Imagine: "Each person that bought this, told on average 1.618 others".
The human collective as a whole must abide by the Golden Ratio.
The previous top was the top only because of the Golden Multiple.
The entire world is now very aware of this level, even the fib-blind.
.
Part of my Idea series collecting samples of my Methodology: (click links)
Chapter 1: Introduction and numerous Examples
Chapter 2: Detailed views and Wave Analysis
Chapter 3: The Dreaded 9.618: Murderer of Moves
Chapter 4: Impulse Redux: Return to Birth place
Chapter 5: Golden Growth: Parabolic Expansions <= Current Example
.
.
Ordered Chaos
every Wave is born from Impulse,
like a Pebble into Water.
every Pebble bears its own Ripples,
gilded of Ratio Golden.
every Ripple behaves as its forerunner,
setting the Pulse.
each line Gains its Gravity.
each line Tried and Tested.
each line Poised to Reflect.
every Asset Class behaves this way.
every Time Frame displays its ripples.
every Brain Chord rings these rhythms.
He who Understands will be Humble.
He who Grasps will observe the Order.
He who Ignores will behold only Chaos.
Ordered Chaos
.
.
.
want to Learn a little More?
can you Spend a few Moments?
click the Links under Related.

Delta Airlines: Placing A Huge Options TradeHey, guys. Not a perfect video here, but wanted to lay down an options trade I built in NYSE:DAL . I have another analysis I made on TradingView a long time back on Delta (Found here: ) and it seems like after months of brutal range trading, the stock now wants to move to higher levels.
After having some already successful trades in the name, I am taking more upsized risk here and placing a big, long-term options trade on this name. I am comfortable holding these long term calls over time as I will be able to roll them down the line (unless Delta is sitting at gross levels in 2025) if they are not performing how I had hoped. I also am happy to take in a solid amount of cash while I wait. Here's to happy flights all across the country and the world!
Hope you enjoy the review, and best of luck out there!

DAL... We have take offGood morning traders,
If you have been following my predictions on DAL and UAL, well... WE HAVE TAKE OFF! OB has been tested, we could see a pullback testing the previous red candle but should be a decent flight from there on out. Some turbulence along the way, but shouldn't be big enough to knock this plane down.
All previous areas have been tested and structurally it looks great. Hang on tight a bit more we are almost there. Keep UAL on your sights, this has much more traveling to do which means bigger profits as well.
Hope you enjoy the rest of your day, and don't forget to follow for all my other predictions. Have a great rest of your week, happy trading & God Bless!
