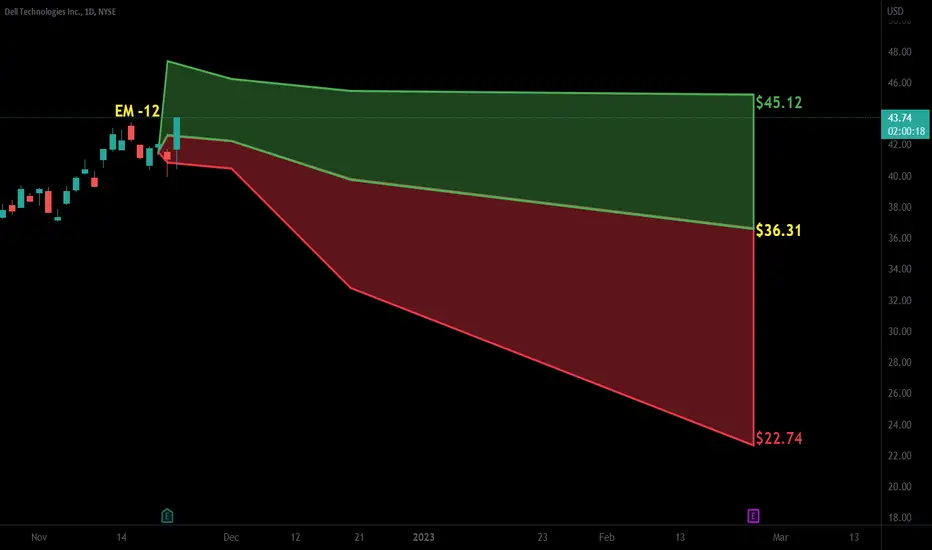
DELL Technologies Options Ahead of EarningsIf you haven`t sold DELL here:
then Analyzing the options chain of DELL Technologies prior to the earnings report this week,
I would consider purchasing the $47.5 strike price Puts with
an expiration date of 2023-7-21,
for a premium of approximately $2.10
If these options prove to be profitable prior to the earnings release, I would sell at least half of them.
Looking forward to read your opinion about it.
DELLC trade ideas

Dell looking Very invitingStructure cant look any better then this. So many confirmations. I do believe all the stars are in line for a buy on DELL
Weekly chart showing a break and retest of last support level with a break of downward trend accompanied by a bullish engulfing weekly candle off support Also see the cross over on the RSI and MACD.


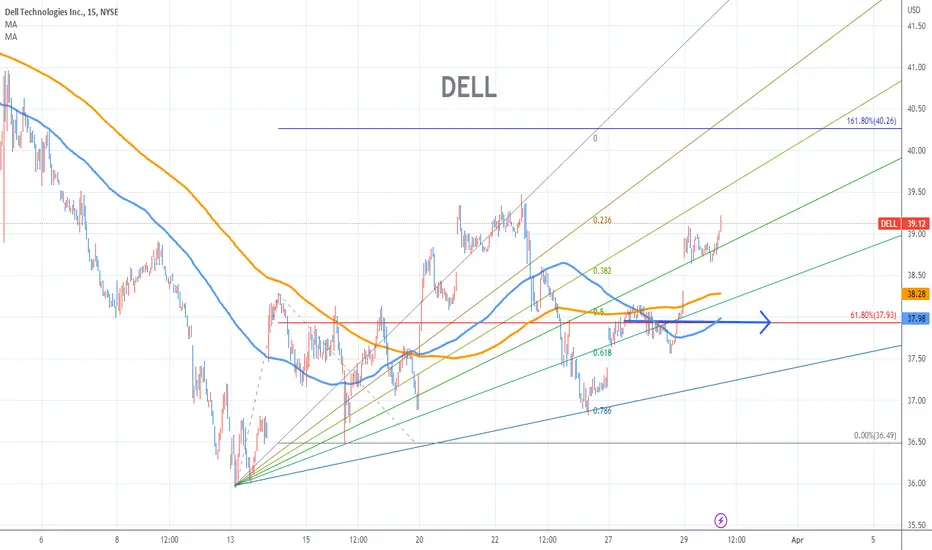
DELL Stock Chart Fibonacci Analysis 032923 Trading Idea
1) Find a FIBO slingshot
2) Check FIBO 61.80% level
3) Entry Point > 38/61.80%
DELL ready to flip bullish trendDELL is looking like it found support and trend reversal to the upside is more likely.

Dell looking good for long termDell had been trying to break through its downtrend line but FED new caused overselling. The price is trading near the support zone and very narrow range in the 1W time frame. Watch intraday and 1D time frame price action if the price tries to take a bounce.

DELL bearish with possible breakdown from the triangleTHE CONSISTENT TRADES analyze DEL as a bearish/weak fundamental stock and therefore would be traded only in a short position.
DELL is in a symmetrical triangle and is near the end of it which could indicate a strong move sooner than later. Break down below the red dotted line would trigger a short position but only if the market turns negative and start its leg down.
Volume is more bearish than bullish as drops are on stronger volume than those on a green day.
Price is below all major MA which is bearish, also all MA are very close to each other signaling a strong move soon.
RSI is neutral.
MACD is also neutral and is also in a symmetrical triangle.
Overall: DELL is holding inside of a symmetrical triangle due to the strong move up on the market. With the likely starting of the leg down on SPY, there is a high chance DELL will break down from a symmetrical triangle and trigger a short position. For the short position, we should wait for the creation of a leg down on major indices or SPY. Only a strong and powerful drop in volume here without SPY in red would indicate a short-sell position.

DELL daily - on the verge of fallDELL is a bearish/weak fundamental stock therefore would be traded in on a short position
DELL is still inside a symmetrical triangle about which we are talking for some time. Last two days price did drop out of the triangle but not below our minor line which is the trigger area for the position.
DELL is below all major MA which is bearish and also 8 and 20 are right at the price which will act as resistance. DELL is hovering around the trend line and can't decide about a future move for now.
Volume is neutral.
RSI is neutral.
MACD histogram is more bearish than bullish due to the red histogram ticks and the fact MACD line is below the signal line.
Overall: DELL is on the verge of a real drop in price. It cant return in a pattern that is bearish for sure. For the bearish move, we need DELL to move strongly below the horizontal red dotted line to trigger a short position.
On the other side if DELL manages to return to the pattern we will continue to watch and follow it until it breaks on one side.
The short position would be triggered only if the price moves strongly on big volume below the horizontal red dotted line or the last few day's lows.

DELL daily - likely shortDELL daily - is inside of a symmetrical triangle below BigRed (200 days MA) which is bearish. It's found resistance at BigRed the last 4 times and got rejected which is also bearish.
Volume is neutral to bearish because the start of this leg up was on weaker volume.
Price is coiling between/inside/around 8, 20, and 50 days MA which indicates that DELL will soon move very hard.
RSI is pointing down which could be bearish.
MACD histogram tick lower (the day is not yet closed) while the MACD line point down which in case of the day finished in red could be bearish.
Overall: DELL is inside this big symmetrical triangle. A daily close below the blue dotted line would trigger a short position while a stop loss would be 1 penny above the upper trend line on the day it breaks out of the triangle. As this is bearish fundamental stock at the moment, I would trade it only to the short side.

DELL - Similar Positions Similar positions pointed out in green circles
Climbing over the mid line of the Fibonacci levels indicator
This may lead to further strong bull gains as was seen in the first green circle scenario
Indicator is called 'Fibonacci Levels'

$DELL with a Bullish outlook following its earnings #Stocks The PEAD projected a Bullish outlook for $DELL after a Positive Under reaction following its earnings release placing the stock in drift A with an expected accuracy of 57.14%.
DELL Excellent buy opportunity on the break-outDell Technologies (DELL) is testing the top (Lower Highs trend-line) of the short-term Channel Down that started after the September 12 High. The 1D MA50 (blue trend-line) is right above it, all within the wider pattern of the long-term Channel Down since the March 29 rejection on the 1D MA50.
However, while the price was on the Channel Down's Lower Lows, the 1D RSI has been on Higher Lows since September 27, waving a Bullish Divergence. As we just bounced near the bottom (Lower Lows trend-line) of the long-term Channel Down, it is highly likely that we will extend the rebound and hit at least the All Time High Lower Highs trend-line (dashed). A good time to take profit and re-evaluate would also be when the RSI hits its 4 month Resistance Zone.
-------------------------------------------------------------------------------
** Please LIKE 👍, SUBSCRIBE ✅, SHARE 🙌 and COMMENT ✍ if you enjoy this idea! Also share your ideas and charts in the comments section below! This is best way to keep it relevant, support me, keep the content here free and allow the idea to reach as many people as possible. **
-------------------------------------------------------------------------------
You may also TELL ME 🙋♀️🙋♂️ in the comments section which symbol you want me to analyze next and on which time-frame. The one with the most posts will be published tomorrow! 👏🎁
-------------------------------------------------------------------------------
👇 👇 👇 👇 👇 👇
💸💸💸💸💸💸
👇 👇 👇 👇 👇 👇

$DELL will slide on Earnings🔸️Ticker Symbol: $DELL timeframe: 4H 🔸️2X Bull Pattern 🔸️Investment Strategy: Short
TECHNICAL ANALYSIS: Lets dig into $DELL here a little; It has not been a very good year for most stocks this year, and no exception is made with DELL. We have the Co-COO selling more than $5 million worth of shares last week; and the YTD coming in at a dismal (-15%). Most analysis have revenue matching closely to the estimate, and missing on EPS by a point. As we look more into the technical analysis viewpoint of $DELL, We have our custom indicator telling us a few things here; money flowing out of the market, and a rejection from our top regression channel. We have fundamentals and technical analysis calling for a sell off; and I will be looking at swinging some puts at the end of the trading day tomorrow for some ER Lotto's!!!
🔔 Follow for daily stock, crypto and forex technical analysis .
⚠️ Trading is risky, and I understand nothing is guaranteed. Proper risk management should be in place at all times to minimize losses. Please consult a financial advisor before trading. All Inclusive Trading LLC is not a financial advisor and may not be held liable for any losses which may occur.

DELL Dell Technologies Options Ahead Of EarningsLooking at the DELL Dell Technologies options chain, i would buy the $45 strike price Puts with
2022-9-16 expiration date for about
$1.34 premium.
Looking forward to read your opinion about it.

$DELL with a Bearish outlook following its earnings #Stocks The PEAD projected a Bearish outlook for $DELL after a Positive over reaction following its earnings release placing the stock in drift B.

DELL accumulation inside Daily Demand Zone?DELL accumulation inside Daily Demand Zone?
Price is looking really nice for possible swing buys.

$DELL with a Bullish outlook following its earnings #Stocks The PEAD projected a Bullish outlook for $DELL after a Negative over reaction following its earnings release placing the stock in drift C.

Dell USA Sun Storm Investment Trading Desk & NexGen Wealth Management Service Present's: SSITD & NexGen Portfolio of the Week Series
Focus: Worldwide
By Sun Storm Investment Research & NexGen Wealth Management Service
A Profit & Solutions Strategy & Research
Trading | Investment | Stocks | ETF | Mutual Funds | Crypto | Bonds | Options | Dividend | Futures |
USA | Canada | UK | Germany | France | Italy | Rest of Europe | Mexico | India
Disclaimer: Sun Storm Investment and NexGen are not registered financial advisors, so please do your own research before trading & investing anything. This is information is for only research purposes not for actual trading & investing decision.
#debadipb #profitsolutions
$DELL could have an 18% run?This is pretty basic technical analysis. If $DELL crosses the yellow intermediate trend line, I would expect the target to be around the upper green trend line. If it fails at the yellow, I would reassess the chart closer to the lower reds trend line. I would take at least partial profit on a tag of the green trend line. There was not much recent news concerning the stock. An upgrade from Evercore earlier in the month and news that $DELL would be working with $NVDA on some new chips

$DELL: 3 Black Crows at the PCZ of a Bearish ButterflyWe have Bearish Divergence on Both the MACD and RSI along with the 3 Black Crows on the Daily as Confirmation that Dell will likely react negatively to this PCZ.

12/5/21 DELLDell Technologies Inc. ( NYSE:DELL )
Sector: Electronic Technology (Computer Processing Hardware)
Current Price: $58.48
Breakout price: $58.00 (hold above)
Buy Zone (Top/Bottom Range): $57.70-$55.90
Price Target: $64.20-$65.00
Estimated Duration to Target: 47-50d
Contract of Interest: $DELL 1/21/22 60c
Trade price as of publish date: $2.18/contract

$DELL Can Dell Take Back the 10/20 EMA?$DELL has shown some Relative Strength in this difficult market. I've made what I think are relevant notes on the chart. This is on my action list to go long if / when it re-takes the 20 EMA. This will give me a low risk entry as my stop will be placed just below the 20 EMA. Ideas, not investing / trading advice.
From earningswhispers.com
Dell Technologies Misses
Dell Technologies (DELL) reported 3rd Quarter October 2021 earnings of $2.37 per share on revenue of $28.4 billion. The consensus earnings estimate was $2.33 per share on revenue of $27.2 billion. The Earnings Whisper number was $2.43 per share. Revenue grew 20.9% on a year-over-year basis.
Dell Technologies helps organizations and individuals build their digital future and transform how they work, live and play.

DELL Opportunity to Ride and Nice Push UPDell as you can see from COVID DIP March 17 2020 has been on a tear recently shedding VMWare to do it's own thing it allowed DELL to focus back on what it does best. As you can see it has been on a constant tear VERTICALLY. It will be facinating to see if it will keep this going or if it will break trend. To me basing on the indicators i would bank on it bouncing off the lower trend line and pushing to the top side as it normally has it has not had many breaks on the bottom trend line and it does to the top side circled in yellow. Pay attention to your indicators showing you neutral signs i would much rather wait for a good entry point on the Stochastic or RSI before throwing my money in the hat, but with the holidays it is a good bet to think they will run.
