DHR: Bullish Breakout from Descending TrendlineOverview: Danaher Corporation (DHR) on the daily chart appears to have undergone a significant bearish pattern followed by a period of consolidation. The recent price action suggests a potential bullish reversal, as the stock has now broken above a key descending trendline, signaling a shift in momentum.
Context & Price History:
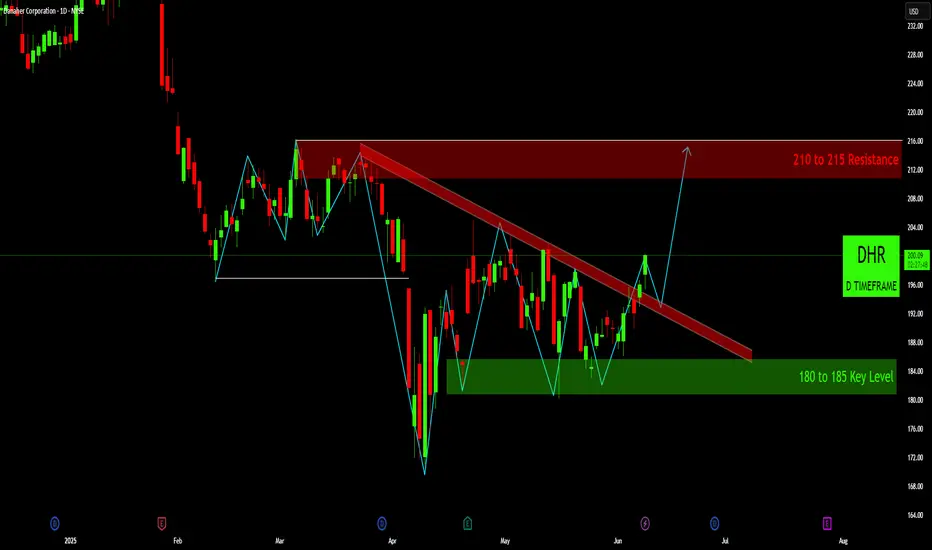
Prior Topping Pattern: From roughly February to April, DHR exhibited classic signs of a topping formation. The price repeatedly failed to break above the 210 to 215 Resistance zone (red shaded area), indicating strong supply in this region. The price action leading to the sharp April decline could be interpreted as a Head and Shoulders pattern or a triple top, with the white horizontal line around 196- 197 acting as a critical "neckline" or support level.
Sharp Decline & Key Support: Following the breakdown from the neckline in April, DHR experienced a significant sell-off, finding strong demand and bottoming out within the 180 to 185 Key Level support zone (green shaded area). This zone has proven to be a robust area of buyer interest.
Consolidation & Descending Trend: Since the April lows, DHR has been trading within a range, largely constrained by a descending trendline (thick red diagonal line) acting as dynamic resistance, while finding support at the 180-185 key level. This price action formed a descending triangle or wedge-like pattern.
Key Levels & Patterns:
Major Resistance (210 to 215): A strong supply zone where sellers have repeatedly stepped in. This will be the primary upside target if the current bullish momentum sustains.
Key Support (180 to 185): A critical demand zone that has held up well, providing a strong foundation for the recent recovery.
Descending Trendline (Red): This dynamic resistance has capped rallies since March/April. A decisive break above it is a bullish signal.
Pivotal Level (~196-197, White Line): This level acted as prior support (neckline) before the April drop. Now, it serves as a minor horizontal resistance that the price has recently overcome, potentially flipping to support on a retest.
Current Situation (As of Analysis):
DHR is currently trading around $200. Critically, the price has made a strong move above the long-standing descending trendline. This breakout suggests that bullish sentiment is gaining control after a prolonged period of consolidation.
Potential Scenarios:
Bullish Continuation (Primary Indication on Chart):
Confirmation: The chart's projection anticipates a retest of the broken descending trendline (which now acts as support) or the ~
196=197 pivotal level, followed by a bounce and continuation higher.
First Target: Upon a successful retest and bounce, the immediate target for buyers would be the 210 to 215 Resistance zone.
Why: A confirmed breakout from a multi-month descending trendline, especially after holding strong key support, is a strong bullish reversal signal.
Bearish Rejection / Fakeout:
Confirmation: If DHR fails to hold above the broken descending trendline and closes convincingly back below it (and potentially below the ~196-197 level), it would suggest that the breakout was a "fakeout."
Downside Potential: In such a scenario, the price could re-enter the consolidation range and potentially retest the 180 to 185 Key Level.
Confirmation & Invalidations:
Bullish Confirmation: A successful retest of the descending trendline (now support) with a clear bounce, or a sustained daily close above the ~196-197 level, preferably with increasing volume.
Invalidation of Bullish Setup: A decisive daily close back below the descending trendline and the ~ 196-197 pivotal level would suggest that the bullish momentum has faltered and the current breakout might be false.
Conclusion:
DHR has presented a compelling technical setup with a breakout from a significant descending trendline. This breakout, combined with the stock holding firm at the 180-185 key support, suggests a potential shift in trend from bearish consolidation to a renewed bullish advance. Traders should look for confirmation of the breakout (e.g., a successful retest and bounce) before targeting the 210-215 resistance zone.
Disclaimer:
The information provided in this chart is for educational and informational purposes only and should not be considered as investment advice. Trading and investing involve substantial risk and are not suitable for every investor. You should carefully consider your financial situation and consult with a financial advisor before making any investment decisions. The creator of this chart does not guarantee any specific outcome or profit and is not responsible for any losses incurred as a result of using this information. Past performance is not indicative of future results. Use this information at your own risk. This chart has been created for my own improvement in Trading and Investment Analysis. Please do your own analysis before any investments.
DHR trade ideas
Multiple LowWe are close to the price low since 2020 now. This may seen as an important support. But the momentumis still high enough so that it may take time to build a bottom here. Before a major attempt to correct upward the lows at around 190 will likely be tested.

Bottom BuildingFor weeks we are testing this level now but cannot break it.
Due to the large drop since January I consider a corrective rise as more likely now.
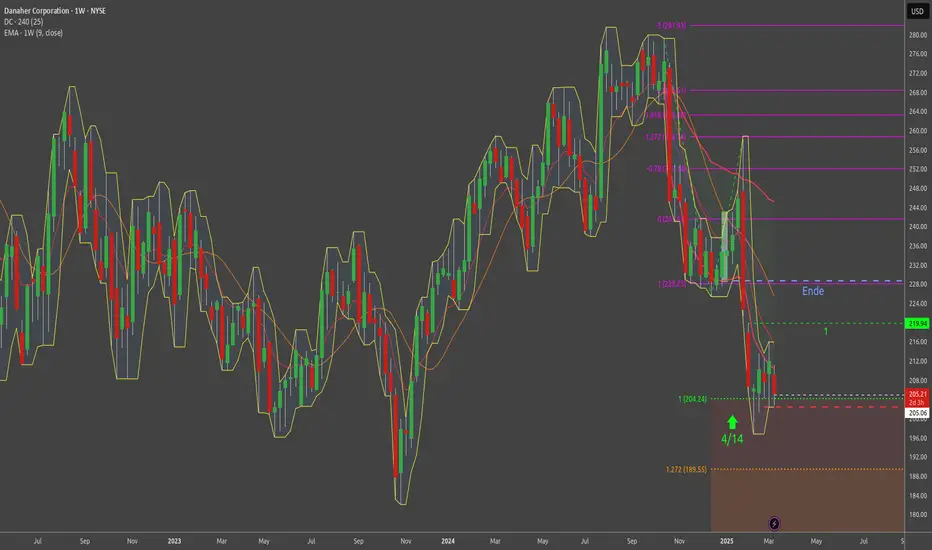
Correction RetracedSupposed to have found the bottom at 195.50 for now it may be time to resume the upward correction after this 50 % downward retracement.
There is an open window to be closed at 222.37.

Overbought and Double Top on 1h chart.Target 1 $207.92
Target 2 $204
Enter at open Monday 3.10.25
3.-14 Puts stk 207.50 $1.65/contract

Higher Highs for Danaher Corp. DHRABC zigzag complete, now out of OBOS territory and MIDAS curve crossed. vWAP is supportive. BB%PCT crossed zero line and growing, VZO ribbon cross noted as well. One higer low established also. Let's go!

Still the SplitThe extended split that the market has done 2-3 days ago has not yet been digested.
The window has to be closed. When it becomes cold and you sit in a split ypo will get cramps definitely. I mean it would be healthy for the market to correct the steep fall and to close the window.
Today will be decisive to learn whether the market is ready to build a bottom here.
I think so as the market seems to be exhausted.

The SplitsA fall fromthe high tothe present low within less than 2 days is a real split.
Nobody can very long hold such a position without getting a cramp.
Thus the spilit shall be closed to a normal position again, i.e. the market will take profit.

$DHR with a neutral outlook following its earnings #StocksThe PEAD projected a neutral outlook for NYSE:DHR after a negative under reaction following its earnings release placing the stock in drift D with an expected accuracy of 57.14%.

Long $DHR off AVWAP and 200DMAEntry $248.84
SL below recent LVN in volume profile $247.13
TP at LVN in 60m TF $258.5
Possibly more room to run above that as well.

Danaher,,, pullbackUptrend
Trading on the pullbacks is one of the best strategies. I see a good pullback to the broken level after transferring between bulls and bears at the S/R zone.
As a trigger for entry, there is a good bullish candle but i will not enter until about 15min before bell to remain this candle in a good shape without up shadow. SL and TP are clarified on the chart.


(New Trade) DHRDisclaimer:
All information posted are the author's own trades/potential trades.
The author is not a certified Financial Advisor and do not have the certifications to provide financial advice.
These information are strictly for educational purposes only and do not constitute any financial, investment or trading advice of any form.
Please do your own research (DYOR) before taking any investment/trading actions.
The author will not be liable for any legal liabilities or responsibilities due to actions taken by any reader of these postings.
Counter has broken a downtrend trendline which spanned more than 2 years in Jan 2024
Since its Oct 2023 lows, prices have rallied impulsively in 5 waves and retraced to its near term Apr 2024 lows which could act as support to allow counter to push up higher in Minuette Wave (iii)
Opened a new position into as a Breakout Trade
Entry: $256.72
Initial S/L: $ 230.74

DHR Potential Buy setupReasons for bullish bias:
- Price bounced from support
- Entry is at breakout of HH
- DOW theory, SL at last HL
Entry Level (CMP): 244.95
Stop Loss Level: 222.23
Take Profit Level 1: 267.67
Take Profit Level 2: 290.39

DHR Danaher Corporation Options Ahead of EarningsAnalyzing the options chain and the chart patterns of PPG Industries prior to the earnings report this week,
I would consider purchasing the 2500usd strike price Calls with
an expiration date of 2024-5-17,
for a premium of approximately $2.85.
If these options prove to be profitable prior to the earnings release, I would sell at least half of them.

DHR - ATH again soonLeaders lead. Has delivered incredible value to shareholders over the last decade. No reason to doubt why it couldn't continue.
Break out of this the daily range should push it to 270 soon.
Disclaimer: no position yet.


Danaher Corp. | Buy Scenario | Wine and waterDanaher in an interesting spot. We are under a resistance level (Resistance area 1) however the level was engulfed already (see orange marking). Looking to buy into if the following should develop:
1. Price breaks above Buy area 1 i want to see a close and open of a weekly or daily candle atleast.
2. Price moves above S/R level 1
Stop- Loss : None
Target: Upper big resistance level and recent ATH
Good luck
Disclaimer:
- This information does not constitute as financial advice and is only for educational purposes. I am not your financial advisor.
- You trade entirely at your own risk
- Make your own research
- Finance and trading is evil, capitalism is bad, duh ;)

DHR Sell off Misunderstood.The recent DHR Sell off is Misunderstood IMO.
Thoughts where that the recent weight loss drugs innovation will negate the need for life or medical device support for these patient types.
And while this is true in the short term, it does not negate the requirements - unless a complete reversal of the said symptoms is seen.
It only extends that outcome.
Only a severe change of one's past poor lifestyle will change this.
However as creatures of habit - do we stop drinking (or worse smoking) or enjoy a chocolate?
A few of us do. Not me YET.
Anyway we will have to see further market consideration and price action.
Lets see.
Smash that Rocket Boost if you like my Analysis.
This is not advice.
Regards Graham.

DHR, Massive BULLISH Wedge-Formation, Major BREAKOUT Incoming!Hello There!
Welcome to my new analysis of DHR. The stock market is in a really important condition currently as there are many interesting stock gems within the market I have spotted in my analytics backend. One of the interesting gems I recently spotted for a major opportunity on the long side of the market is DHR. This gem has major underlying potential to increase a huge breakout dynamic in the upcoming times.
When looking at my chart now DHR is bouncing several times within the major ascending channel formation, this channel formation is a substantial origin of several support bounces from where DHR could increase with bullish momentum volatility. Now, DHR is bouncing within the range for the next consecutive time and is already marking the level as a main support from where the next main bullish expansion spike is likely to emerge.
What is so important within this whole newly developed formational structure is that DHR is now also forming this momentous descending wedge-formation in which it already completed the coherent wave count especially bouncing within the lower boundary of the wedge and is now building up the further determinations. The fact that DHR already completed the wave count and bounced within the lower boundary is already nearly completing the whole descending wedge formation.
With these main underlying confirmational developments, DHR is building a massive bullish base here. Putting this into perspective this means that DHR is likely to emerge with the final wedge-breakout within the next times which is going to form the completion-setup with the breakout above the boundary as marked in my chart. Once DHR has formed this completion-setup it is going to be the main origin of the bullish wave-expansion towards the upper directions and reaching the target zones with the wave-C extension.
Thank you everybody for watching my idea about DHR. Support from your side is greatly appreciated.
VP

Danaher (DHR): Life Sciences GiantA Great Business | Fund Favorite | Danaher is a stock Mutual and Hedge Funds Love | The company has a stellar high-moat M&A-driven business model with strong pricing power and often anti-cyclical customers | Compounder Starts To Look Attractive
Dividend Stock Brilliance | Danaher has a wide-moat business model, strong pricing power, anti-cyclical customers, and strong industry growth | Offers solid growth and operates with a recession-resilient business model | The company's potent top-line growth has enabled it to continually invest in capex and products without impacting its cash flow |


watching DHR for a potential short-term bullish trade"Based on 17 Wall Street analysts offering 12 month price targets for Danaher in the last 3 months. The average price target is $277.76 with a high forecast of $310.00 and a low forecast of $250.00. The average price target represents a 19.37% change from the last price of $232.69."
- Tipranks
