DOW ETF: Waiting for GodotWaiting for the DOW parabola to reach its top, we have seen many false tops. Is this another, or is it the real thing?
DIA trade ideas

A short punt on the Dow 30 ETFAfter this week's euphoria, the Dow will surley take a dip. This may become the Big Dip, but a punt on a local dip is in order. A Stop Loss in place in case we are wrong, and a Trailing Stop to anticipate the share pulling out of the dip sooner rather than later.

Dow has rallied nicelyUpdate on the Dow. The Dow has also rallied nicely from its MTPredictor DP support zone that I showed in my last Post.

REPUBLISHING JAN 9, 2014 DJIA DIA FORECAST - untouched"""""
2014 Forecast:
The market has not built enough time up here to sustain a long term rally. But with more time at lower levels then accumulation can develop and the bull market can continue. However, from current levels the market is not on sturdy ground. The market is stretched up at 165 and support is down at 149 and implies a downside risk of 10%. The time of the last consolidation was 12 weeks and we are in the 12th week of the rally. So, time has run out. Since the market has needed 20 weeks of accumulation before each previous rally, it is bearish to me that it only took 12 weeks in this latest accumulation.
The factors driving the market until now have been clear (stock buybacks, earnings growth, Fed driven low interest rates, equity fund inflows), but we are ahead of rational long term valuations and I would not recommend committing new funds to this market.
I think this year will be at best a sideways to down year as investors still have very few choices on where to invest and stocks will be a focus, primarily because money has flowed into equities and out of bonds and corporations have repurchased stock and issued debt. Corporate leverage is up. Margin buying is at record levels. Investors are optimistic again. Analysts seem unanimous in forecasting higher prices.
This is a great time to do the opposite and walk away.
""""""""
I also republished this at the highs this summer to point out that I felt we had 10% down potential going into year end.

DIA AT CRITICAL LEVELDIA is at bottom of lower purple trendline and in a resistance zone of past lows

DJIA ETF -DIA -Daily -August Options Expiry Was Today's LowI normally watch only the SPY (SP500 SPDR ETF) for options expiration key levels, but I thought I'd check the DIA and see how it looked and here it is.
Lately too, the volume on the downside since mid-July has swamped the buying days. So, either people are shorting DIA against their portfolios on down days to hedge (like the good old days) or this is just an observation.
You can see now that 169 is a key resistance area just overhead. If we see 169, I'll be selling and looking for 166 and change to cover, then will look for 164.5, then 164.0.
Cheers.
Tim 11:05PM EST 10/2/2014

DIA - monthly chart studyNoticeable divergence. How long and how far can it go? No idea and do not care. However will dump 100% once the pink support line breaks.

****IMMINENT STOCK MARKET CRASH AT HAND??????******STRANGE******I have not one clue about why this market is behaving the way it is right now . . . The exponential moving averages and the simple moving averages on the DIA suggest that the market is very bullish. MOREOVER, if one takes a look at the ADX indicator, the RSI indicator, the Stochastics indicator, and the MACD indicator, all of these indicators suggest a pullback on a Daily chart. HOWEVER, although the indicators suggest a pullback, strangely enough they tell a different story on a weekly chart. MOREOVER, on a weekly chart the indicators display massive divergence in this market that has been building up for SEVERAL MONTHS!! Furthermore, now that the month of October and November are quickly approaching, then perhaps one would need to consider some precaution, for it may be possible that this weekly scale divergence may unfold during the coming months . . .

****IMMINENT STOCK MARKET CRASH AT HAND??????******STRANGE******I have not one clue about why this market is behaving the way it is right now . . . The exponential moving averages and the simple moving averages on the DIA suggest that the market is very bullish. MOREOVER, if one takes a look at the ADX indicator, the RSI indicator, the Stochastics indicator, and the MACD indicator, all of these indicators suggest a pullback on a Daily chart. HOWEVER, although the indicators suggest a pullback, strangely enough they tell a different story on a weekly chart. MOREOVER, on a weekly chart the indicators display massive divergence in this market that has been building up for SEVERAL MONTHS!! Furthermore, now that the month of October and November are quickly approaching, then perhaps one would need to consider some precaution, for it may be possible that this weekly scale divergence may unfold during the coming months . . .

Dow at a high as well ?Is the Dow Jones at a High as well.? As you can see, the Dow has started to retrace from the MTPredictor DP resistance level, which suggests a decline is now coming. The only question is how far. I have added two possible DP support zones on the chart.

$DIA Monthly chart still looks long(BIG TIME FRAME)No reason to think market will crash/capitulate. It MUST distribute 1st, AFTER we break parabolic curve. We should come down a little in coming weeks, but healthy for more upside.


REPUBLISHING Tim West's January 2014 FORECAST FOR DJIAI just find it interesting that so far this forecast is going along pretty close to reality - The market did move down in the first part of the year and it dropped the same magnitude (almost exactly) as forecast. Then the new high occurred and that happened after the correction and to nearly the exact same price as forecast. Now that we are facing the end of the year and the forecast was for a decline into the end of the year... can you believe that this forecast will come true???
Tim 8/16/2014 3:36PM EST Saturday
Here's the text of the forecast for this year 2014, from January:
2014 Forecast:
The market has not built enough time up here to sustain a long term rally. But with more time at lower levels then accumulation can develop and the bull market can continue. However, from current levels the market is not on sturdy ground. The market is stretched up at 165 and support is down at 149 and implies a downside risk of 10%. The time of the last consolidation was 12 weeks and we are in the 12th week of the rally. So, time has run out. Since the market has needed 20 weeks of accumulation before each previous rally, it is bearish to me that it only took 12 weeks in this latest accumulation.
The factors driving the market until now have been clear (stock buybacks, earnings growth, Fed driven low interest rates, equity fund inflows), but we are ahead of rational long term valuations and I would not recommend committing new funds to this market.
I think this year will be at best a sideways to down year as investors still have very few choices on where to invest and stocks will be a focus, primarily because money has flowed into equities and out of bonds and corporations have repurchased stock and issued debt. Corporate leverage is up. Margin buying is at record levels. Investors are optimistic again. Analysts seem unanimous in forecasting higher prices.
This is a great time to do the opposite and walk away.
-----------------------

The Dow 2007 vs 2014Of course, the projected future waves are pure speculation and I'm not expecting any patterns to repeat themselves exactly. There do exist, however, 7-year and 13-year cycles in the market that deserve consideration and further research, considering the similarities I believe to be showing quite clearly in this comparison. I have made an effort to simplify this by keeping any drawings to a minimum and, by the way, the year 2000 doesn't have the same resemblances. Thanks to Chris Moody for his 2xEMA (20 and 100) Trend Detection script. Do feel free to comment!

DIA - Long term bearish here...Clear divergence trade on monthly may change sentiment until Christmas, i am curious to see how it handles

Dow Jones - On-balance volume strategyI have checked and over checked this strategy a few times, so I hope there won't be too many mistakes. As you will see, this is a very simple and effective strategy, which produces signals when used on its own, without adding any other indicator on the chart or using any fundamental factor. All you need is the OBV indicator, candlesticks and support and resistance. This is how it goes :
1 Look for a divergence on OBV. It shouldn't be a divergence when the price goes flat, it should be a divergence formed on two peaks or troughs. Note that only class A and B divergences have been taken into consideration.
2 After spotting a divergence, wait for a bullish or bearish candlestick like : hammer. shooting star, doji, engulfing, piercing line, dark cloud cover, abandoned baby. Candlestick patterns can be considered too : Evening/morning star, island reversal.
3 Look for the first structure support, that is the start of the current rally or the start of the current correction and set a target above or below it by a few points. On that particular target, position should be closed by <=50%, of the entire position.
4 Before getting to the target, after moving in your favor, the stop should be adjusted to breakeven.
5 The remaining of the original position should be closed when the trader sees fit, or till a contrary signal appears. I have not found a proper closing signal yet.
In the period this strategy was tested, it produced 39 signals. That means 3 signals each year.
4 signals were whipsaws, the red lines.
5 signals broke even (if the stop would have been adjusted to breakeven after the trade moved in your favor)
11 signals went to structure support, and made a rebound.
19 signals went a lot below structure support, with some of them even predicting long lasting corrections.
You can see that I'm using the word support, and not resistance. That is because this strategy doesn't really give long signals, most of them are shorting signals. Out of the 39 signals, 9 were long, 30 were short. Out of the 9 long signals, 6 went through the immediate resistance, 2 made it only to the resistance, and one of them failed.
This is a trading strategy that I'm going to use from now on, separately from my usual trading system. I'll be back with more information.

Dow - correction startedThis market has been really annoying, and hopefully this was the last push up before the correction I've been expecting. There is no demand left in the market, as you can see on my new indicator, the Weis Wave (THANK YOU SO MUCH LazyBear FOR CLONING THIS INDICATOR, I DIDN"T KNOW ABOUT IT UNTIL I SAW YOU PUBLISHED IT). Double bearish divergence on the MACD lines and histogram and we are still in a bearish divergence on the weekly!

Dow Jones Dow Jones, like the S&P, are destined to rise before the long-awaited correction.
Judging by the volume of the past month or so, large bets have been placed on the long side. As for the past trading day, the large volume bar was a pseudo-indecision bar.
I'll be on the sidelines for right now, as I would have entered at the completion of the Gartley that formed.


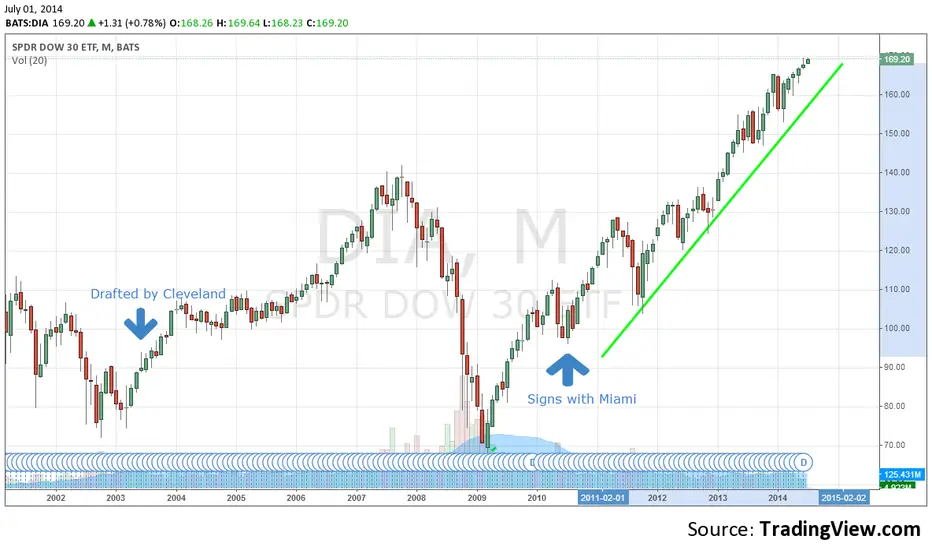
LeBron James Sides With Bulls, SPDR Dow Jones Industrial AverageBack in 2003, as the US economy was coming out of a recession, the markets were slowly trying to get up off the mat. The tech wreck of 1999-2000 had sent the markets into a tail spin and all the major indexes suffered substantial losses; including America's sweetheart index the Dow, represented here by the SPDR Dow Jones Industrial Average ETF (NYSEARCA:DIA). So, while most people were looking at improving economic data and low interest rates as the reason for the turnaround, I was looking at the emergence of LeBron James.
Many of you are probably scratching your head and thinking, what is this guy talking about. Well hear me out, as some of the facts are quite interesting. On June 26, 2003, "King James" was drafted by the Cleveland Cavaliers. That day the Dow had a closing print of 9079.04. Over the next few years as James started to hit his stride in the NBA, the markets moved up higher right alongside the basketball phenom. In the 2006-07, LeBron James was playing the best basketball of his career to that point, and lead his Cavs to the final. They eventually lost out to the San Antonio Spurs in four straight games. Then a few months later on October 11, 2007, the markets topped out with the Dow closing at 14015.12. Over the next few years James would continue playing for his hometown Cleveland Cavaliers, but would not reach the finals again, and the markets would not reach those lofty levels during that same period.
In the summer 2010 King James was a free agent and speculation swirled around what team he would choose and on July 8, the much anticipated "DECISION" was announced. The basketball star was taking his 'talents to south beach' to play for the Miami Heat. That day the Dow had a closing price of 10138.99. So from the time LeBron was drafted, to the time he switched teams, the markets had gone up just over 11%, which is a bit uninspiring considering it was over 7 years.
So how did the bulls of SPDR Dow Jones Industrial Average ETF (NYSEARCA:DIA) feel after the superstar switched teams? Since the day of the historic move to Miami, you could say the markets really began to "HEAT" up. The Dow has blown past the previous high water mark of 14198.10 and gained nearly 70%, and seems to be hitting new record highs on a daily basis. After seeing this interesting correlation between LeBron James and the stock markets, one has to say that it won't be just the basketball world who is awaiting the free agent's decision. While it might be far fetched to say that LeBron has any effect on the markets, it is none the less interesting to note the timing in certain events.
Would you place your market wagers on the direction of Lebrons career? Comment and let me know your thoughts. Either way, as smart traders and investors we know there is always a great trade waiting for us; all we need to do is keep the odds in our favor.
Come step inside the Elite Round Table and take advantage of the market moves and live trades when we initiate. Within the Elite Round Table we provide members with first hand access to our detailed trade alerts via text and email so you can take action on the go. We look forward to having you join us as we navigate the markets and make money!
Parm Mann
Elite Round Table
Follow me on twitter: @ParmMannTrader
Join the Elite Round Table on Facebook
do i have to republish an idea i just found some improvementr i yes, i wish i could edit an idea i just published. i believe it's a natural human instinct to improve on something i just realised i should have done differently...
