10/18 DIS(1) pink zone as demand zone (holding well currently)
(2) target 200+ (potential around 1Q22)
DIS trade ideas


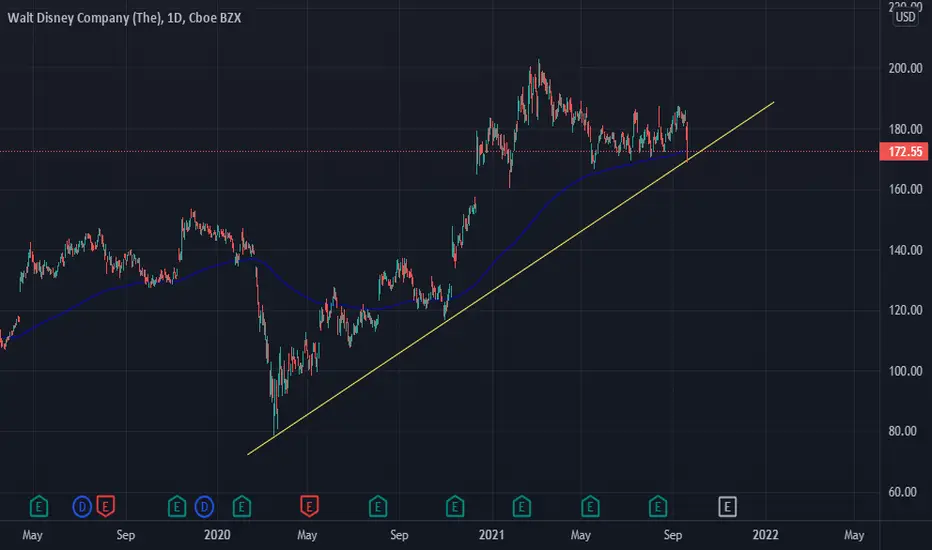
DIS at supportDIS is sitting at support all year long.
We have ER coming in Nov 10,
Could be a good R:R trade here from these lows
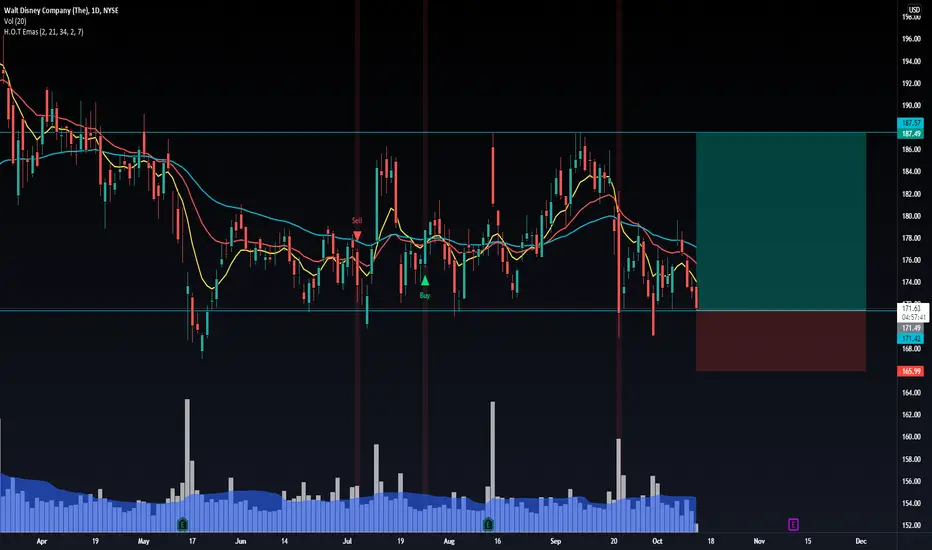
DIS - Quick Swing and then LowerCould jump into some 11/19/21 175/180C's for a quick swing at support here but overall I see this heading lower towards 150's.
Disney | Fundamental Analysis + Next TargetWhen it comes to the success story of 2021, one such example might seem to be the Walt Disney Company. This is the studio behind two of this year's highest-grossing movies. In addition, Disneyland in California reopened in the spring, and the company resumed its cruise ship voyages in the summer.
In the latest quarter, the company's revenues grew 45% higher than expected, the biggest annual growth in the company's history, though of course, these numbers followed depressed results the year before. Disney is back in business, but the same cannot be said for its stock chart. After climbing 26% last year -- when the company was underperforming -- the stock is down 4% in 2021. That seems unfair, so let's break down why Wall Street isn't so happy about the House of Mickey Mouse's success these days.
An assessment of this year's seemingly inexplicable decline must begin with an assessment of last year's inexplicable rise. Disney was hit hard by the pandemic, posting double-digit year-over-year revenue declines for four consecutive quarters before this year's spring rebound. With theme parks either closed or running at limited capacity and big-budget movies not being released in theaters, it's easy to see why last year was a tough one for the House of Mouse.
Disney+, however, has proven to be a kind of silver bullet in this pandemic. Launched in late 2019, the premium streaming service has swiftly burst into homes around the world through 2020. There are now 116 million paid subscribers worldwide. Although it accounts for a small portion of Disney's revenue mix, the success of the new service has given investors reason to view the media giant as a promising streaming stock for which broader valuation multiples are acceptable.
However, Disney+ was not a driver in the 2021 calendar year. Subscription growth slowed and average revenue per user declined as the service rolled out to new countries where monthly subscription rates are lower. The move has brought attention back to Disney as a blue-chip media mogul, and that's not as easy a sell as it might seem in the current environment.
Income investors who rushed into Disney when the company suspended payouts in the early stages of the COVID-19 crisis have no intention of returning because the company has no plans yet to restore payouts Disney seems in no hurry to return money to its shareholders in cash payouts, especially when that money can be used to create streaming content, upgrade theme parks and expand its cruise ship fleet.
As popular as Disney+ is, Disney doesn't expect it to turn a profit until the fiscal year 2024. Its broadcast and media networks division, which held up reasonably well last year as people spent more time watching TV at home, still faces a problematic future with consumer abandonment of cable and satellite TV services.
If all this sounds bleak, let's end with a fabulous ending worthy of a classic Disney cartoon. Disney stunned investors when the theme park segment returned to profitability in the last quarter and the future became even brighter with new monetization initiatives that will lead to per capita spending growth next year. Disney is already winning at local theaters again but is holding back some of its biggest blockbuster releases in the coming quarters for now. The fiscal year 2022 -- which began less than two weeks ago -- will be a strong year for Disney. The company's stock may not reflect that right now, but with only a trading day or two left before a positive 2021, it wouldn't be a surprise if Disney rises higher by the end of this calendar year. Disney stock may drop for a while, but it's certainly not over.

Auto Fibonacci levels with 52W high low with key levelsAuto Fibonacci levels with 52W high low with key levels
This indicator shows 52 weeks high and low as constraints in the chart.
Works for any time period and any stock/currency/index/gold/oil/crypto
It helps users to identify key support and resistance levels and decide entry and exit points based on Fibonacci levels.
Updated version with auto-indicator coming soon....

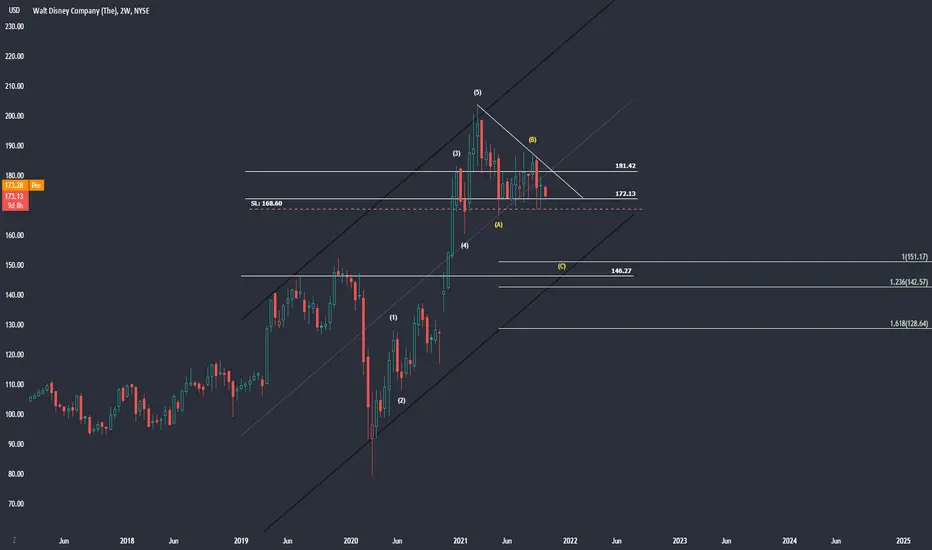
Wait Disney : Completed CorrectionWait Disney stock Completes Correction on Both timeframe and Pricewise...now waiting for breakout...once Stock Breakout it will expected to Give 25-30 percent return in next 3 months...
Can go long above 180 with SL 165 for target 230

DIS Bounce Off 172.60NYSE:DIS
The lines represent the price level that has been traded upon or will be traded.
The more it hit the line, the stronger the level.
It can be use to set profit taking price or stop loss price.
Every level is of same significant until order flow trades upon it.
DYODD.

Disney | Fundamental Analysis 🔔So many things are going on at the Walt Disney theme parks in Florida this week. Disneyland officially turns 50 on Friday, and unveils 18 months of new rides, attractions, and themed merchandise that should make turnstiles click and cash registers ring.
The media titan stunned investors when the theme park segment returned to profitability last quarter, much quicker than anticipated. Now it's time to see if theme parks can turn back to pre-pandemic revenue levels. That achievement may be easier to accomplish than you think. Disney has set its sights on increasing its per capita income to the point where it can make more money with fewer guests than before.
Paying more attention to higher-paying visitors through a tiered park reservation system, raising admission prices for day guests and annual passes, and introducing premium entrance to expedited lines are largely unpopular moves for Disney World fans. But they are the reason Disney will not only withstand but flourish over the next 18 months.
The most challenging attraction in all of Disneyland was the "Star Wars: Rise of the Resistance" attraction. Since its debut at Disney's Hollywood Studios in late 2019, people have had to secure a boarding group through the My Disney Experience app. Until Thursday of last week, to get a virtual boarding group from stock, which usually ran out within seconds, you had to walk up to your phone by 7 a.m. Another similarly short window opened at 1 p.m. for those who were already in the park.
Because the high-tech attraction was frequently out of service during most weekdays, and visitors favored the no-rail, dark Star Wars-themed attraction, Disney encountered a supply and demand problem. After the attraction began running more steadily (and the crowds were few and far between in the seasonally sleepy September), the boarding process was modified on
Thursday of last week. Disney World did away with the virtual line. People can now get in line for the ride just like they do for the rest of the resort's dozens of rides.
The transition has been refreshingly smooth. According to some initial reports, wait times were as long as three hours, but most of the reported wait times were within an hour or two, which is more than reasonable for an attraction that raises the bar for critics.
Opening access for the ride is very important. Guests who want to visit the attraction no longer have to give up the idea if they plan to come to Disney's Hollywood Studios later in the day.
Financially, the transition now opens the door for Disney World to begin charging for access to the new Lightning Lane+ queue, which will allow park guests to get through to the attraction even faster. Disney will soon begin introducing lucrative (but controversial) premium pricing for expedited queues, as most of its smaller competitors have long done. As wait times for "Star Wars: Rise of the Resistance '' and other famous attractions are expected to jump this weekend (and remain long for most of the next 18 months), a lot of money can be made by allowing visitors to pay for shorter wait times and more time elsewhere.
Another effective and less provocative development working in Disney World's favor is that international travel restrictions for European visitors will be relaxed in November. Since its opening, Disney's domestic theme parks have been forced to cater mostly to visitors from the states. Now the door is finally starting to open for lucrative international tourists -- just in time to partake in the golden anniversary celebrations.
On Friday, all eyes will be on the Magic Kingdom theme park, where it all began 50 years ago. Epcot Park, located within the resort, will also draw crowds of visitors as the new Remy's Ratatouille Adventure attraction opens Friday. Both parks will also feature new nighttime shows, and both parks will have new roller coasters open for 18 months.
The other two Disney World theme parks will not attract as much attention as the resort's two original parks, but they will become tourist magnets for people spending a week or more at the resort. The advent of Lightning Lane+ will also make the resort's two most popular attractions -- Star Wars: Rise of the Resistance at Disney's Hollywood Studios and Avatar: Flight of Passage at Disney's Animal Kingdom -- more accessible to those willing to trade money for time.
All of this will lead to big business in the Disney theme park segment. Even those regulars who don't normally buy trinkets may not be able to resist buying commemorative merchandise for the milestone. Less frequent visitors who have been putting off a trip to Disney World will have few excuses not to visit now if they can afford the increased prices. This is a golden anniversary for Disney, but also a golden chance for a major travel and tourism industry company.

Trading Idea - #Disney "Let's make Disney great again"BUY LIMIT ORDER!
ENTRY: 163.84 USD (wait for the dip to the support zone!)
TARGET: 200.00 USD (20% profit)
STOP: 155.00 USD
1.) 163.00 USD provides a solid support level! Let's pretend that we will see a trend reversal!
2.) The number of subscribers to Disney Plus is not yet optimal. That caused the stock to go into correction. The medium-term subscription goals of the group still seem reasonable.

Disney Disney tight here, looking for a break out. market is weak today however Dis still held up in the market

Disney back at the bottom of its trading range.Could be good for a swing trade back up to the top of its range if it moves back up again which I would think it should after being caught up in the market sell off.
Keep your stops close though in case it breaks through that support area and then again when it gets close to the top of the range and bumps up against resistance.
Worth a look.

DISNEY LONG Aside from the traditional low to high fib drawing. I also utilize a high to high fib. These are my favorite set up. Here we have disney. 170 is the ideal entry zone with targets at 218. the 50% line has been respected multiple times which proves there is buyers at this level for now. long term target is 218. Stops below 162.

DIS - Iiiiiiit's tiiiiiimeThis chart is starting to look very constructive! The accumulation has started to take off, using AVD with one minute accumulation data.


DIS trending towards next resistance levelNice squeeze for EMA's and SMA's DIS trending up to next resistance level.

$DIS - Disney during the last week of September (9/27 - 10/1)Mouse Man had a rough week after the CEO guy on TV said no dividends next quarter. Or something? (Honestly, I don't remember).
ANYWAY -- I think more chop is coming next week. The most bearish scenario I have has Disney testing the 168 area, but I won't post that until the price action breaks down a bit more.
Overall market sentiment should play an interesting part too, as some hesitancy still exists for October.
more later,
bye buds.


$DISShares of entertainment conglomerate The Walt Disney Company closed down 4.1% in Tuesday’s trading after the House of Mouse disclosed a disappointing forecast for growth in its Disney+ division.
Chapek warned that the Delta-variant fueled wave of Covid-19 is impacting movie and TV production and will delay releases in the coming months. The pandemic-related suspension of the Indian Premier League cricket season last spring also means less sports content on Disney’s streaming services in India over the summer. And Chapek said that the launch of Star+ in Latin America in recent months had proceeded more slowly than expected.
Taken together, that means Disney+ and its international equivalents might add “low single-digit million” subscribers in the current quarter, which is Disney’s fiscal fourth, Chapek said. Wall Street analysts’ average estimate had been for 17 million additional Disney+ subscribers in the period, according to FactSet.
But when we look at the charts we can see price is bouncing around in a symmetrical triangle on the weekly timeframe.
It’s very hard not to be bullish on Disney but we should keep this on our watchlist and wait for the break before entering this trade.
RSI sitting near 50.
MACD wants to curl.
Watchlist activated.
- Factor Four

$DIS call hedges lol...If we retrace back up tomorrow, going with DIS as a stock that is sitting on a volume shelf for potential quick recovery. Other than that mostly bearish until I see the market rebound.

Disney's move to $225?Feels like a cup and handle forming, right? 200 EMA support, back over 50 EMA and marching back towards ATH. I suspect we see Disney gets back over $200, then takes another dip before moving up to $225 by February or March.

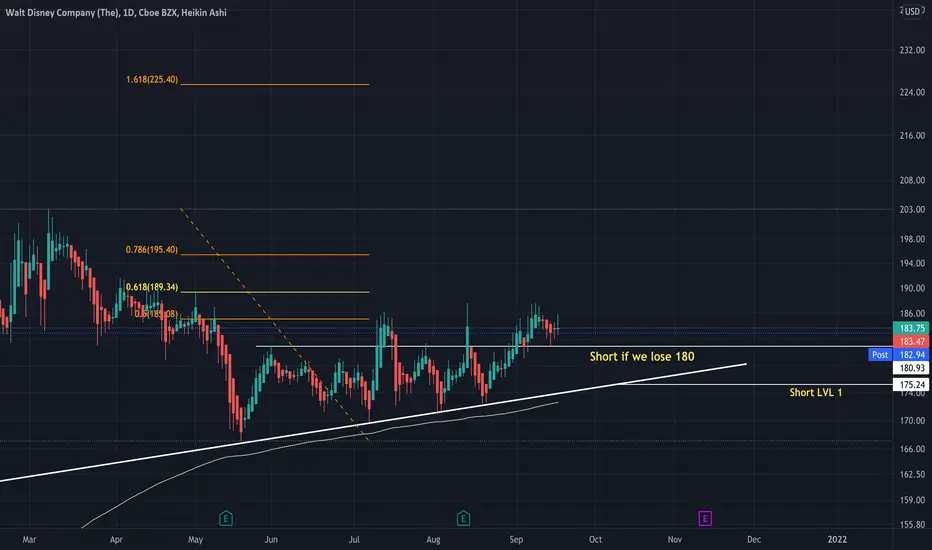
DIS Long ideaAs long as Disney holds 180 this one will continue strongly to upside.
189 195 203 R LVLS
Can run to 220's nxt once above ATH. Entered NOV 200C today intraday.
Strong ascending chart.