$DIS - Ready to move as per Longer TimeFrame Charts As visible n the charts, $DIS has been consolidating in a narrow range for a very long time and its not been a wealth creator for investors since 2015.
On weekly time frame, Bull Power Bear Power indicator suggesting that $DIS may be ready to move ahead but cant say if it will be a multi bagger in coming years or not but its definitely a trading candidate for 20-25% gains from here for a next few weeks .
Disclaimer :
Trading is never ever recommended as it is injurious to mankind. This is purely my study based on technical charts and for educational purpose only. Please do your analysis before taking any trades given by me. I MUST not be held responsible for any profit or loss out of any trades you take on our advice. All Disclaimers Apply.
DIS trade ideas

$DIS daily (Wyckoff and AVWAP)Disney daily appears to be going through wyckoff accumulation and currently appears to be in Phase D before Phase E breakout.
Retest of AVWAP, now we go.
Looking for the volume shelf/AVWAP to hold, otherwise invalidates the trade.
$188 Alarm for entry

$DIS back on (weekly)Recently made good money trading Disney and looking to re enter a trade
Weekly MACD ready to cross , nice cupping base.
Purple line is Annual AVWAP , notice the close above AVWAP last week followed by a retest with buyers stepping in keeping price above so far...Bullish
11/19 $195C looks like an idea depending on OPEX price action tomorrow

Disney Head and Shoulders Potential Right Shoulder Puts EntryComcast recently reversed off a bearish signal, perhaps Disney will be next given that they are in the same sector.

Bullish: Disney Beats Quarterly Revenue EstimatesDisney has been stuck in a bit of a range for a while now, but with positive revenue news and things starting to open back up there good be some good growth ahead.
RSI, MACD and OBV are all starting to turn bullish. Might be worth a look.

In Depth on DIS(time frame analysis)I will go in depth on why I believe DIS is an amazing play but will do so by review each time frame one by one. From 15min-Daily-Weekly. We will start with the 15min as I believe that has more expressing to be conveyed.
► LONG 15min Chart(Intraday)
I was already bullish on DIS so I wanted to watch the intraday to make sure this stock wasn't demonstrating a false signal and I believe we have gotten signals indicating to go long. Today we have seen DIS go below a VWAP support that was vital to predicting its future direction but since we have gotten bull signals from the VSLRT and the Stupid Willy, I did not consider this a breakout. Instead we have seen the stock rise and not only close above the VWAP support but the 20sma, which lays within the Bollinger Bands. Next we need to see DIS close above the VWAP resistance I displayed that currently rest at 185.22.
► LONG Daily Chart(Intermediate)
Nothing too notable about the daily chart other than that it has displayed bullishness via the VSLRT indicating that we are seeing volume support the uptrend that we are currently having. Not only that but the Stupid Willy is demonstrating the conventional bull signs such as rising Williams %R and bullish momentum.
► LONG Weekly Chart(Long term)
There is something very bullish that can be seen via the weekly chart and that is the squeeze signal given by the Bollinger Band Width. Basically this signal occurs when we are about to get a big spike in volatility to either the downside or upside. Since the other time frames are bullish while the weekly also displaying bullishness via the VSLRT and the Stupid Willy I think we are about to see a massive up-move for DIS. This is important to note because it is vital to see whether stocks or taking the path of least resistance or are fighting a trend.

$DIS Sign of Life!$DIS starting to see some signs of life breathing back into it.
* Rounding a 5+ month base
* 50 MA starting to turn back up
* volume pattern improving (pocket pivots starting to show up & OBV turning up - more needed here)
Would like to see it correct that wedge up before it goes
Is $DIS ready to climb a little higher?IDK. this is a lazy idea. Wanted to post for fun.
Love to all my fans.

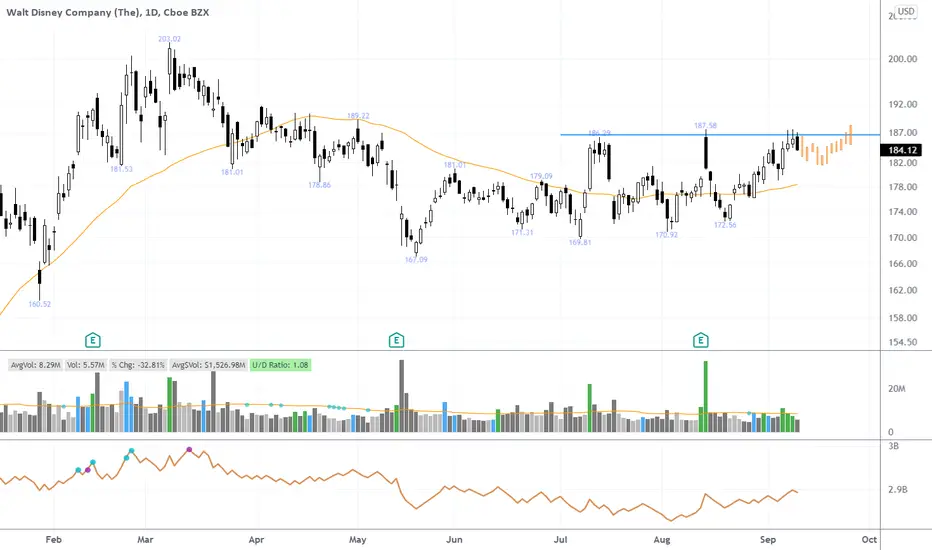
DIS 9/12/2021The Walt Disney Company(DIS)
Sector: Consumer Services
Current Price: $184.12
Breakout price trigger: $187.55
Dip Buy levels: $181.50, $178.90, $176.40
Price Target: $189.20-$190.40 (1st), $194.00-$196.80 (2nd), 202.00-204.20 (3rd)
Estimated Duration to Target: 5-6 days (1st), 33-37 days (2nd) 77-85 days (3rd)
Contract of Interest: $DIS 10/15/21 190c, $DIS 12/17/21 200c
Trade price as of publish date: $2.81/cnt, $3.90/cnt

DIS: Watchlist for long/short positionDIS (swing): False breakout on daily wedge
~Watch support at 181.40-182.50. If a bounce is seen we could see an impulsive move towards PT 189.50
^^^Since Aug 19, we have consistently had higher highs/higher lows, so this is the likely scenerio
~If support is broken and we close a day below 180, puts with a PT1: 176 and PT2: 174.50 are likely
$DIS - currently a triple top on the daily.Looking for $DIS to break over this range. Currently stuck in a weekly channel.

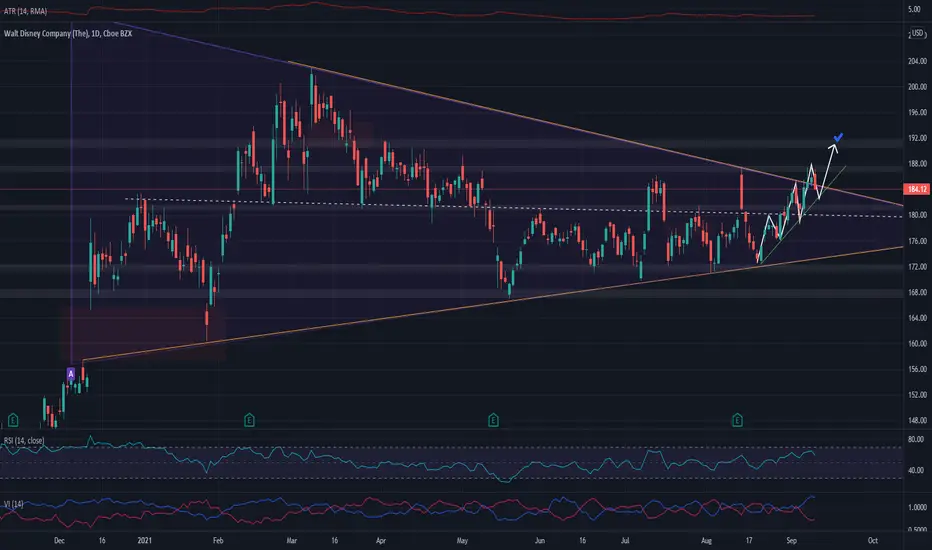
Disney is getting ready to move...Whichever channel Disney moves into (hahaha! TV pun) after breaking out of that triangle will determine where she goes.. Personally I think it moves into the steeper angled channel and continue moving up thru the end of the year and then settles into as consolidation channel and moves sideways a bit until Q2 of 2022 earnings.


Disney Holds the 200-day SMABelieve it or not, Walt Disney is little changed for the year. But now the longer-term uptrend may be ready to resume.
The main pattern on this daily chart is the rising 200-day simple moving average (SMA). DIS has tested and bounced at that line several times in the last month. It’s also held the 50-day SMA, which is almost on top of the 200-day.
Next, consider the level around $185. It became resistance in early May, and again this summer. DIS tried to break out following its last bullish earnings report on August 12 but quickly retreated. Now it’s right back challenging the line again.
The weekly chart also shows a narrowing pattern between about $170 and $185 since early May. This creates the potential for prices to expand if they escape the top of the zone.
DIS could also be interesting fundamentally as it grows in streaming and reopens theme parks . That, combined with the onset of football season (ESPN), may provide some bullish catalysts in coming months.
TradeStation is a pioneer in the trading industry, providing access to stocks, options, futures and cryptocurrencies. See our Overview for more.

Double top for Disney ?hi all,
this came up due to me helping a friend, here we have Disney on a 1hr chart, with a possibility of a double top, (awaiting the 2nd red candle)
this double top is at the top of a uptrend, which buyers have tried to push the price up twice, in failing to do so this could mean a bearish turn and we could gain a few pips on the way down!
** this is not financial advice and this is my opinion and this is for educational purpose only **
trade safe and good luck
L

Disney Analysis 06.09.2021Hello Traders,
welcome to this free and educational analysis.
I am going to explain where I think this asset is going to go over the next days/weeks and where I would look for trading opportunities.
If you have any questions or suggestions which asset I should analyse tomorrow, please leave a comment below.
I would also appreciate, if you would smash that like button and help me to create more free analysis like that.
Thank you for watching and I will see you tomorrow!

Dis one of my favs right nowDIS has been one of my favorite setups for awhile, but continues to be rejected in the 180's. Based on the symmetric triangle this thing could take until November, but I think it will break out sooner then that.
Wave theory has a intermediate wave 1 PT of somewhere in the 190's at a minimum (if minor wave 3 goes on a 261.8 extension it will be 200's).
there is a chance we see a drop / consolidation down to around the POC before catching support and hopefully making our move higher. On the weekly time frame we continue to be rejected at the 30 MA, when that breaks I expect a retest and then launch. This one should provide us some fireworks soon, definitely worth having on your watchlist or taking a long position on a dip WITH TIME! (if options)
Stop loss for me would be uptrend break to the downside

Clear Buy/Sell signals on 15m time frame for DISUsing the Options Alerts indicator () to automate fibonacci retracements, support & resistance levels based on previous candles, Clear Buy/Sell signals with a dashboard showing overall trend.
Testing this indicator with Heikin Ashi on 15M DIS chart, shows more accurate & timely Clear Buy/Sell Signals.

DIS to break trendline in coming daysDIS is on the verge of breaking the trendline to the upward in the next few trading sessions.

$DIS -- Methinks the Mouseketeers are about to #printI'm too tired to post any clever witticisms but Disney looks primed to run to 185, especially if it quickly turns 180 into support this week. Feels like there's a little bit of pump left in SPY/QQQ (mostly due to to Tech) before big money turns back to pumping IWM (see: SPRT, BBIG...)
Anyway, DIS 180c/185c should be fun to play this week (9/17 and 10/15 viable IMO). Quicker fingers can probably flip 200c's as well if things get really bullish.
night night kiddos.
btw I tried ketamine and my review is: "eh, not for me."
bye!

$DIS Weekly Disney appears to be forming a rounded bottom implying a move to the upside - PT $200 by mid to late OCT. Williams %R and MACD showing bullish confluence. Call flow hot with a buyer watching for a break above the AVWAP at $181.8.
Like the idea of the 10/15 $195C and 180/175p credit spreads.

Trade Setup: Buy/Long Walt Disney Co.Published just after midday on our client platform. For more insights and real-time ideas, get in touch today.
Today on European markets, travel firms and retailers are leading gains, with optimism around potential re-openings. During yesterday’s US trading session, we also took at a look at leisure firms (including Royal Carribean Cruises), with the price action and structure firm amidst sentiment. In a related sector, the Walt Disney Co (DIS) has been a trading sideways since it’s recent earnings release however yesterday’s candle formation is signaling potential for move higher. In addition, the trading range has contracted while the price is rebounding off it’s rising 200-day moving average.
For the trade to trigger, we would like to see a close above $183.22, combined with a positive day (higher close than previous day) as well as a breach of the symmetrical triangle formation.
These are my provisional levels:
Buy on a close above $183.22
Stop: $177.40
Target: $197.00
Last Close: $181.30
