DKNG DraftKings Options Ahead of EarningsIf you haven`t bought DKNG before the rally:
Now analyzing the options chain and the chart patterns of DKNG DraftKings prior to the earnings report this week,
I would consider purchasing the 40usd strike price Calls with
an expiration date of 2025-1-17,
for a premium of approximately $1.94.
If these options prove to be profitable prior to the earnings release, I would sell at least half of them.
DKNG1 trade ideas

Support 1st and then break through resistance Looks like DKNG will find support 1st at about $35.15 and then it will probably test resistance at about $39.24. Earning is in 8 days and I believe positive earnings will push it past $39.24 to $42 to $45 range.

$DKNG Short-term Bullish, Daily TimeframeHey what's up ya'll! I hope you guys are doing well. There are many companies that are reporting earnings this week ( NASDAQ:DKNG is reporting next week Thursday, Nov 7).
I'm still debating whether or not to hold contract passed earnings since it may cause a drop and I would rather exit then to hold. If I'm up at least 15% on the contract I'll put a trailing stop loss.
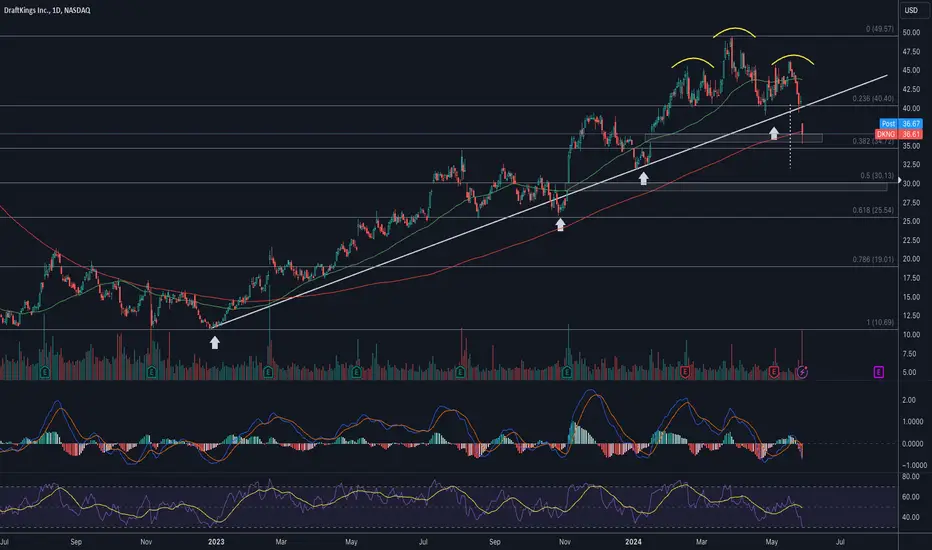
Contract purchased:
- 17 JAN 25 40c (down -5%)
Entry Price:
- $37.22 @ 3:34pm
Rationale for contract:
- Price appears to have hit a support around $36 (previous resistance)
- Price hit the all-time 0.618 bullish Fibonacci
- MACD curling up; blue line approaching the orange line that indicates bullishness
- RSI @ 46; near the medium line of 50
Conclusion:
If price goes below the previous weekly low at $36, I'll cut.
If price hits $41 before earnings, I'll sell or put a 5% trailing stop loss.


$DKNG Looks attractive!NASDAQ:DKNG looks attractive. It broke out of the wedge and is now checking back to the trendline. The ideal buy area would be around POC support.
On the longer-term time frame, it is forming a cup and handle ☕️ with a measured move of $70 to $83.
I hope to start a position soon.
As always, I share my opinions and trades. I'm not suggesting anyone follow my trades. You do you.

My Watchlist: DKNGDKNG, I have a green setup signal(dot Indictor). It has an excellent risk-to-reward ratio. I'm looking to enter long near the close of the day if the stock can manage to CLOSE above the last candle highs(white line). If triggered, I will then place a stop-loss below(red line) and a price target above it(green line).

DKNG from $41.70 to $36.50MODs have suggested that I provide more detail about the picks I make.
Sorry. I'm not as verbose as y'all, and I don't like things to be complicated.
My trading plan is very simple.
I buy or sell at top & bottom of parallel channels.
I confirm when price hits Fibonacci levels.
Bonus if a TTM Squeeze in in play.
I hold until target is reached or end of year, when I can book a loss.
So...
Here's why I'm picking this symbol to do the thing.
Price nearing top of channels (period 100 52 39 & 26)
Stochastic Momentum Index (SMI) at overbought level
VBSM spiked positive
Price at near Fibonacci level of $42.14
In at $41.70
Target is $36.50 or channel bottom

DraftKings possible doube H&SLarger Head and Sholder formed with possible rejection at both 100 MA Daily and 50 MA Weekly resistance.

$DKNG - bet on the KingNASDAQ:DKNG chart looks like it is getting ready to rocket. Closed the daily on a bullish hammer after being in the red almost all day. Closed above the 21EMA, $0.10 away from the 9EMA, and looking to tag the 50EMA next week. Anchored VWAP shows we bounced nicely off the 1 standard deviation. Sell target would be when we hit the 2 standard deviation which this has done multiple times and rejected (i.e. purple bands). Improving fundamentals coupled with recent acquisitions and this is ready to move higher.
Based on fib extensions and resistance lines I would like to sell a portion of the position around $42.66 and $45.41. Not out of the realm of us hitting these targets within the next 6 months given sports betting season is upon us.

DKNG DraftKings Options Ahead of EarningsIf you haven`t bought DKNG before the previous earnings:
Now analyzing the options chain and the chart patterns of DKNG DraftKings prior to the earnings report this week,
I would consider purchasing the 36usd strike price Puts with
an expiration date of 2024-8-2,
for a premium of approximately $1.65.
If these options prove to be profitable prior to the earnings release, I would sell at least half of them.

Draftkings: Medium-Term ForecastingMy theory is there an opportunity the sports gambling company is entering an inverted wave five.
Utilizing Fibonacci pitchfans to detect a median for retracement, along with converging time cycles, I have a specific range as seen in the chart. This would break the longer term pitchfan, which price has currently retraced to the median, confirming the bearish move. Note that price is at a lower high than the previous wave high.
This theory is potentially invalidated closing above 44.70 restructuring a potential standard wave one and most likely invalidated above 46.60 creating a new high above the inverted wave two. More than likely I'm predicting the targets won't be reached within the timeframe if this becomes the case.
Fundamentally, DKNG is not a strong earnings company, negative p/e, and football season kicks off after farthest EW target.
Multiple targets as the price closes at or below pitchfans' levels.

DKNG back again for a Donkey Kong !!Long anywhere here or wait for a pullback to 38.
Target 1 - 50
Target 2 - 55
Stop Loss - 35

Draft Kings - Would you 'BET' against DraftKings at this point?DraftKings - DKNG - Would you BET against DraftKings at this point? DraftKings is firing on all cylinders. Will it run 500% back to all-time highs or is it over for DraftKings. Seems sports betting is here to stay? Price and the 50 day EMA are above the 200 Day Blue EMA 'watermark'. What are your thoughts? Do you see a pullback in the near future?

Gap down?Seeing oeak price action. Stoch rsi showing overbought conditions. AD also peak with price action and stochastic rsi. Looking for a retest of June Gap down

DKNG DraftKings to the Moon?DraftKings is back above the 100 EMA and broke through the gap pivot zone. Blue skies to the Moon? Otherwise, will price retest the Gap pivot zone? What are the odds on that?

DraftKings DKNG - Dip then Flip?DKNG still hasn't broken out of the yellow line pullback. If price continues down to about $36 (near the 200 day EMA, price will be 100% away from all-time highs. What are your thoughts? Wait for price to break out from the yellow line pullback, then buy Leap Call options anticipating a move toward all-time highs?

DKNG flushed and then went dry LONGDKNG is a solid large cap with great price action. Today it drained 5% and then put on the
stopper. Price reversed and stabilized in the afternoon session. The fall was to below the
second lower VWAP band in deep undervalued territory. I see this as a chance to pick up DNKG
at a 10-15% discount for a long trade. The dual time frame crossover of the faster line over
the slower line is reassuring bullish divergence enough for me to look for the best entry on
the lower time frame chart.

$DKNG Head and shoulder breakdownNASDAQ:DKNG Head and shoulder + trendline breakdown. Full measured move for the breakdown is $32. Watch $32 to $30 area for a potential reversal. 👀
DKNG eyes on $35.50: Illinois tax hike dumped to MAJOR supportHigh flyer for the year with a decent dip now.
Major support here with a Golden Genesis fib.
Good possible long entry with SL just below.
$ 34.74-35.50 is the immediate support.
$ 33.01-33.21 is next support but minor.
$ 25.66-25.81 way below is ULTRA strong.
=======================================

DKNG Showing Strength DKNG is at a possible Macro-Higher Low putting in a 4h pinbar with a small hourly flag. Will be a good stock to keep an eye on this week for potential buy opportunitites.

Draftkings Earnings Preview and Analysis DraftKings ( NASDAQ:DKNG ), a daily fantasy sports contest and sports betting company, reported a 53% year-over-year revenue growth in Q1 2024. The company's performance was attributed to healthy revenue growth and a scaled fixed cost structure, which allowed for the rapid improvement of Adjusted EBITDA. The company successfully launched its online sportsbook in Vermont and North Carolina with efficient customer acquisition, and its platform and overall customer experience are improving, leading to excellent customer retention and participation across sports and games.
DraftKings increased its fiscal year 2024 revenue guidance to $4.9 billion from $4.775 billion and the midpoint of its Adjusted EBITDA guidance to $500 million from $460. The company's structural sportsbook hold percentage also exceeded expectations, reaching 9.8%, a significant increase from the previous year. However, DraftKings reported a loss of 30 cents per share, an improvement from 87 cents per share the previous year.
Executives stressed the company's "unbelievably efficient" first quarter and noted a 40% year-over-year decrease in customer acquisition costs (CAC) in April. CEO Jason D. Robins highlighted the company's focus on proprietary technology solutions, including significant advancements in sportsbook offerings and the expansion of its iGaming portfolio with new, unique titles.
Robins also highlighted the use of artificial intelligence (AI) to improve product efficiency and customer experience. AI initiatives include modeling and detecting signs of problem gaming, allowing the player intervention team to properly flag issues for investigation. However, there was little mention of payments and payouts during the call, as less than half of gamers now have access to instant payouts.
In summary, DraftKings' Q1 2024 revenue growth was driven by efficient customer acquisition, product innovation, and a focus on customer-centricity. The company's stock price remains relatively unchanged, but it has seen a significant increase in monthly unique players and a focus on responsible gaming initiatives.
Technical Analysis
Despite a positive earnings beat, using Elliott Wave Theory, DraftKings stock ( NASDAQ:DKNG ) appears to have completed its fifth bullish wave within a bullish divergence pattern. This suggests a potential shift in momentum, with indications of a forthcoming bearish divergence. It's essential to monitor closely for confirmation of this divergence and its implications for future price movement.
However, the technical indicators remain constant without any clear-cut. The stock has a Relative Strength Index (RSI) of 50.83.

DraftKings Inc. (DKNG) Technical Analysis ReportThis analysis of DraftKings Inc. (NASDAQ: DKNG) provides an in-depth examination of the stock’s recent trading patterns, supported by various technical indicators and market data. We aim to offer speculative price targets and recommended trading strategies, suitable for both experienced traders and those new to the stock market. We will cover key aspects such as price movements, volume analysis, and oscillators, concluding with specific trading recommendations.
DraftKings Inc. has shown a fluctuating trading pattern over recent periods, demonstrating a dynamic interplay between bullish and bearish sentiment. As of the latest close, DKNG stands at $42.17, showing a notable decline from its recent high, reflecting a 2.00% decrease in the latest trading session.
The 10-day Simple Moving Average (SMA) currently exhibits a buy signal at $41.83, suggesting some support at this level.
Conversely, the Exponential Moving Average (EMA) readings for 20-day and 50-day are positioned at $42.72 and $42.69, respectively, showing sell signals. This suggests short-term downward pressure on the price.
Notably, longer-term EMAs such as the 200-day EMA indicate a buy signal at $36.51, suggesting a stronger base at lower price levels.
The Relative Strength Index (RSI) at 47.04 indicates a neutral market condition, neither overbought nor oversold.
The MACD oscillator points to a buy with a current reading of -0.53, indicating potential upward momentum.
The Momentum oscillator at 1.57 and the Stochastic RSI also suggest bullish signals, indicating possible short-term upward price movements.
The On-Balance Volume (OBV) shows an upward trend with a reading of 152.017 million, suggesting strong buying pressure and potential accumulation by investors.
Trading volume has been robust, supporting the observed price movements and lending credibility to the strength of current price levels.
Price Targets and Trading Recommendations:
Given the mixed signals from both the moving averages and oscillators, a cautious approach is advisable. However, speculative bullish sentiment could target a short-term price of $45.50, close to recent highs. Conversely, bearish pressure could see the stock testing support around the $39.00 mark.
To Long: Consider going long if the price sustains above the 10-day SMA of $41.83, with a stop loss just below at $40.50, targeting a move towards $45.50.
To Short: A short position could be considered if DKNG falls below the $40.00 support level, with a stop loss at $41.00, aiming for a target of $37.00.
DraftKings presents a complex but opportunistic scenario for traders. The mix of bullish indicators and support levels suggests that while cautious, there is potential for both upward and downward movements depending on market sentiment and emerging market conditions. As always, traders should ensure they are managing risk appropriately and considering the broader market context in their decision-making process.

DKNG Down?NASDAQ:DKNG If you trade: chart patterns, fibonacci levels, or divergences, you see it. I see it. Don't miss it. Let the trend break and enter on a retest. With earnings coming up, this play could be big.
