Resultados de la implementacion de innovacionesEl mercado siempre será el juez de las acciones del CEO
EBAY trade ideas


Shorting EBAY sharesOn the H4 chart of EBAY, it seems that that the instrument has comleted its local 1-5 Elliott cycle and ready for ABC zigzag correction. In addition, we can see the AO indicator divergence in the 5th wave which a soling indication of the trend end. Going short using levels that are marked on the chart. What do you think?

EBAY - Sitting at Resistance - Pullback imminentAs the title suggests, EBay is currently retesting previous resistance. Due to being overbought, we feel this stock will fall to the downside and retest previous support

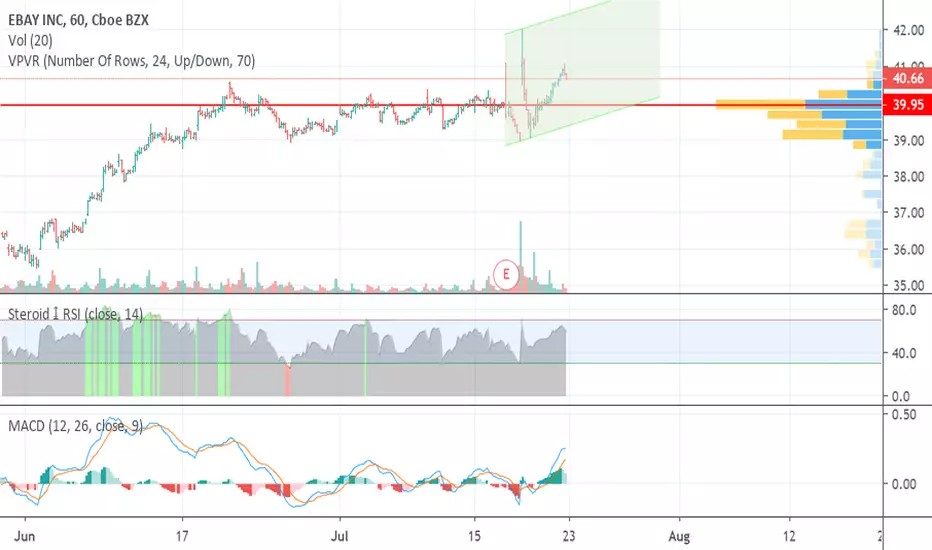
EBAY bullish above $41.50 but caution needed. Despite the blowout earnings and new initiatives announced by EBAY the reaction has not been amazing, thought the chart is bullish and has momentum to the upside, we would advise caution on taking a long, as we state on the chart there is some bearish patterns hidden within the chart.
Long but tight stop loss and respect pivots.
COMPANY DEVELOPMENTS
EBay launched two significant new tools that will enable sellers to better manage and grow their business, and announced a series of robust seller protections. The new tools enable sellers to better manage their business by giving employees secure and limited access to their eBay Seller Hub, and improved inventory pricing insights through the Terapeak integration. Multi-User Account Access - Starting today, all sellers will be able to grant access to their Seller Hub in a more private and secure way. Sellers can now add employees or delegates to perform seller activities on their behalf without giving full access to their eBay account. Listings will be the first capability to roll out. Sellers will be able to delegate editing, drafting and publishing access for their listings to their employees. This provides both users - the seller and the employee - added security and privacy for their eBay account. Later this year, we will enable more permissions including shipping support for sellers to delegate. eBay is among the first ecommerce companies to enable this feature at scale, beginning with this roll out in the U.S. Terapeak Integration - Starting today, all sellers will have access to Terapeak's pricing insights in a new Research tab within Seller Hub. Terapeak provides demand and pricing data to help ecommerce sellers know what your product is worth, what you should source if you are looking to expand and how to competitively price your listing. Terapeak also provides sellers with up to one year of pricing data. This is just the beginning of the integration, more insights will be added into the tool by the end of 2019. Terapeak was acquired by eBay in December 2017
EBay to launch Managed Delivery service next year eBay is introducing Managed Delivery, a cost-effective fulfillment service to launch next year, beginning in the U.S., that will provide shoppers faster and more reliable delivery on millions of popular products. The initiative will enable sellers with high-volume inventory to meet rising consumer expectations while reducing cost and complexity. Managed Delivery will provide sellers the ability to store, pack and ship their products through expert logistics partners managed by eBay. The new service allows sellers to store inventory closer to buyers in strategically located warehouses across the country, resulting in faster delivery time and lower shipping costs. eBay will power the Managed Delivery experience through a global technology platform and third-party partners will run the operations.
SOURCE thefly.coM

Ebay guidance upgrade for second quarter in a rowEbay surged Friday on the strength of an earnings beat and a guidance upgrade, Ebay's second in a row. Ebay's core Marketplace business has struggled, but its subsidiaries are driving growth. I should have grabbed the pullback to $39 per share, but I totally missed the opportunity. Hopefully it will pull back again, and I can pick it up for $40 per share near its high-volume support. Ebay's guidance upgrade should move the price higher in coming weeks.
$EBAY Short targeting 36.5 - 34 - 30.8 3 Months to reach the goal of 42 now its required to hold back to good support and fill up the below gap targets below are 36.5 - 34 - 30.8

EBAY LONG but get in near 32 now its 35.98 Goal is 42Clear uptrend . most indicators corrected the upper trend and now ready to bounce back and start new trend while EBAY shares still near 36 resistances . Earning this week and can be good reason to drop to the main support 30-32 then can bounce back with new long trend targeting 42 at least .. its one of the best charts for 2019 but get long positions on the right moment. as expected market can drop hardly during following days and when bounce back EBAY will be one of the best options for 2019 . check out the previous analysis below..


EBAY Nice retest gap yesterday Missed entry by two cents. Finished day strong on hourly with a shaved bottom and shaved top in other charting program, bracket setup up based on daily candle with entry at break of hourly candle. possible resistance around $40.89, keep close watch for exit if needed. If breaks lots of too to run. I will exit no later then 2/16 before earnings.

Continuation of eBay after retest didn't fill my order .After the market open had a nice pull back while at the gym. didn't reach my entry. moved to a 15min chart and found a nice MSR pattern, but didn't have funds to entry going to follow along anyways.

Playing the breakout long on EBAYNice looking hammer candle at an old resistants looking to make new support. Retest gap premarket risk/reward has room.

Uptrend in EbayEbay breakout of a consolidation/ sideways pattern. There a good chances that the trend will continue to the upside. Wait for better entry for the pullback to the breakoutzone. Target 42-43$
Stopp 37.8$

EBAY SHORT ON DAILYRejecting off 61% Fibonacci.
Two bearish candles at 61%.
Will open short position on market open.

At Least .52 and Likely More!Given support and resistance, and the expected market conditions for Monday morning; I would say at least .52 (target for the pattern is actually 38.21)....and if it breaks through and keeps going! All indications spells the following: Profitable Day-Trade
This is not trading advice.

Short Setup on EBAY by ThinkingAntsOk4H CHART EXPLANATION:
If price breaks down the Support Zone of the range, it has potential to start a downside move towards the Support Zone at 31. A few days ago it started to show weakness on MACD, as we can observe the Bearish Divergence while the price tried to make higher highs.
Daily vision:


$EBAY Not a great deal of confidence pre earnings, bias is shortWe have had a short bias on this stock for some time despite a bounce since December lows. Momentum in that recovery has staled considerably and the activist stimulus has run its course. Ebay competes with possible the greatest company that exists today in the retail/tech world, AMAZON. We will remain short in EBAY and long in AMZN into earnings in what will be a pivotal week for the both companies.


eBay seemingly risky buysOverall, eBay is in an uptrend. Price recently tapped resistance at $38.60 and has moved back to weekly support, albeit pretty hard. I’m confident support will hold based on eBays current trend as well as the bullish sentiment of the overall market...tight stops, please

EBAY # EBAY3 months is consolidating.
Strong Monthly Demand zone created around 30 dollar a share
looking to go long at 28 dollars a share


$EBAY EBAY, sorry, but it just isn't Amazon.Ebay was having a dreadful time until it was announced that activist investors had stepped in. It is thought there is much value to unlocked in the stock but we just cant see it. It is in the same marketplace as AMZN, whom can outspend EBAY at any moment the feel like EBAY is taking any market share.
