EEM short at daily desending trendline EEM reached the middle term daily desending trendline. shorted with stop above TL.
EEM trade ideas

Emerging Markets & Global Recession = OpportunityUS technical recession confirmed with Atlanta Fed GDPNow data indicating retraction in Q2, two consecutive negative GDP prints. While US stock markets have already experienced the worst first half of the year in more than half a century.
Typically in a bull market, this would signal the bottom of a retracement is already in or nearby. Unfortunately, this isn't a bull market and there's still significant downside risk from here. The Fed Reserve and Central Banks continue to have rampant inflation that challenges price stability while the second half of the mandate (low unemployment) remains strong.
Unemployment #'s will rise as tighter monetary policy takes shape in form of rate hikes and slowing securities to mature and roll off the balance sheets. Unemployment is unlikely to raise to a level of concern as there are 2 jobs available (nearly 12 million) per each unemployed person. The more likely scenario is underemployment as individuals find income in roles they are overwrites for.
In addition to unemployment, overnight reverse repo facilities are setting $2 Trillion flow back consistently, indicating a significant oversupply of money without quality investment potential.
Implications for emerging markets is clear, tighter monetary policy will drive these lower as global recession takes hold.
Looking at long-term parallel channel and major support levels, further downside from 18% to 24% is well within range and likely given the additional pullback expected.
How does this get played? Shorting EEM is an option, however there's more attractive potential in going long with inverse ETF's (leveraged or not) via entities like ProShares & Direxion. One example is the 3x $EDC bull / $EDZ bear ETF's benchmarking MSCI Emerging Markets.
Indicators: OBV On-balance volume, MA6/EMA18
Currently, taking a position with the inverse $EDZ play in the short-term is attractive. This will reverse and requires attention, it also involves risk that the broader economy has already bottomed or is close to the bottom... but the data implications don't appear to support that position at this time in my opinion.

Emerging Markets over S&P 500 (5/5)Emerging Market equities have underperformed the US for the last decade, and has now reached past lows during the dot-com bubble.
Looks poised for another reversion in the next 10 years!
EM is cheaper (has already fallen mainly due to weaknesses in Chinese equities)
DXY likely to weaken in the long-term, which should benefit EM equities.
Monthly RSI also seem to be putting in bullish divergence.

$EEM Some near term risk, great long-term R:R (5/5)recently bouncing off of potential trendline support.
RSI is also at very attractive levels.
HOWEVER, be aware that dark blue line support has historically been more enduring. Which would be the buy point should we enter recession in the very near future.
Nonetheless, a good place to start adding long-term positions. Also, relative performance to US and relative value to US is very promising for the long-term as well.

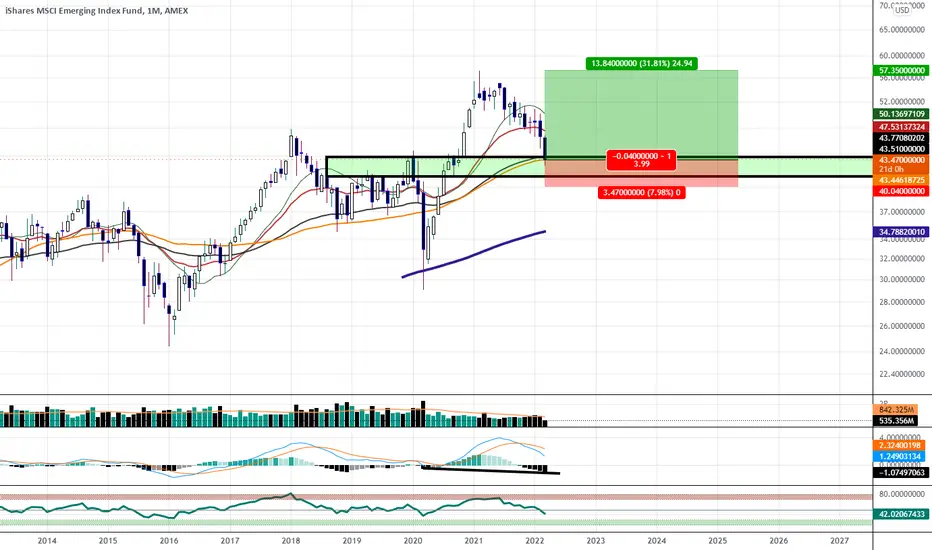
EEM emerging Mkt bottomed @39 or fall further to 37 or 36?EEM now near 41, has already fallen more than 30% from Feb2021 top at 57.19. Two weeks ago it fell to 39 the green VWAP from 2016 & bounced with a weekly hammer candle. It is now being rejected by a FIB CHANNEL level near the yellow 41-42 pivot zone. Holding this zone will see more upside maybe up to 44 or 46 before a c-wave down.
If 41/42 does not hold, there are only 2 strong supports down:
One is at 37, the black VWAP from 2011, which will be another 9% drop from current price.
The worst one is at 36 ( the red VWAP from 2009), another 14% drop from here, making the total crash of 38% from ATH.
The 37 to 36 zone will be a good place to slowly average down into EEM. Note that the dollar index DXY seems to be topping out near 105, which will be good for emerging markets, gold, silver, commodities & maybe BTC, which are all priced in terms of dollars.
Not trading advice

MSCI Index Emerging Markets MSCI Index seems bottoming out on monthly chart
Buying should start immediately soon in all Emerging Markets in upcoming days .
#nify #niftybank #commodities

EEM may retest base of WEDGE since 2007@37; see Buy & Sell zonesEEM Emerging Mkt formed a big Violet wedge since the 2007-2008 crash. It currently gapped down & broke 40, a 0.618 level. If it does not reclaim 40 in the next few days, then It will go down to
37 to retest the lower edge of this wedge. 37 is also a 1.618 retracement of the latest rally.
See the 3 zones in the chart. Red is the sell zone. Yellow is the neutral zone & green is the buy zone.
The bottom may be near for EEM specially if inflation, the DXY dollar index & TNX the 10-yr yield will peak out soon, pushing equities & risk assets higher. Rise in commodities is also good for EEM countries.
Not trading advice

Corelationship Between EEM and SPYJust a little post to highlight that it is important to note when EEM is out of synch with S&P and ask why.
EEM often mirrors what the S&P does. As the U.S. stock market goes up and down it affects other countries.
BUT, it's also worth noting that, sometimes, emerging markets are affected by global market events before the S&P is. Which makes sense. A lot of their economies, industries, etc. aren't as robust as the U.S. so will take more damage or have a greater response to positive catalysts.
EEM is often a leading indicator of where SPY is going.

Long Emerging Markets as the World DeDollarization BloomsAll the empires and dynasties I studied rose and declined in a classic Big Cycle that has clear markers that allow us to see where we are in it.
This Big Cycle produces swings between
1) peaceful and prosperous periods of great creativity and productivity that raise living standards a lot and
2) depression, revolution, and war periods when there is a lot of fighting over wealth and power and a lot of destruction of wealth, life, and other things we cherish

EEM 1D wolfe wave bullishA Wolfe Wave is a chart pattern composed of five wave patterns in price that imply an underlying equilibrium price. Investors who use this system time their trades based upon the resistance and support lines indicated by the pattern.

Short set upPrice Action Broke through C leg of the ABCD pattern. Currently short and looking for a retest of D leg, which will set up a triple bottom

Emerging Markets ETF Showing Bullishness at SupportWe are at the 55 Month Moving Average and it happens to align with an old Monthly Resistance that we are now testing as Support; If at any point we start to rally we will have MACD Hidden Bullish Divergence Develop on the Monthly Timeframe.
$EEM SHORTWar and Russia's weight on the ETF itself made it brake support and enter bear territory. Extreme volatility and high risk means SELL, given the confirmation in price action.
AMEX:EEM

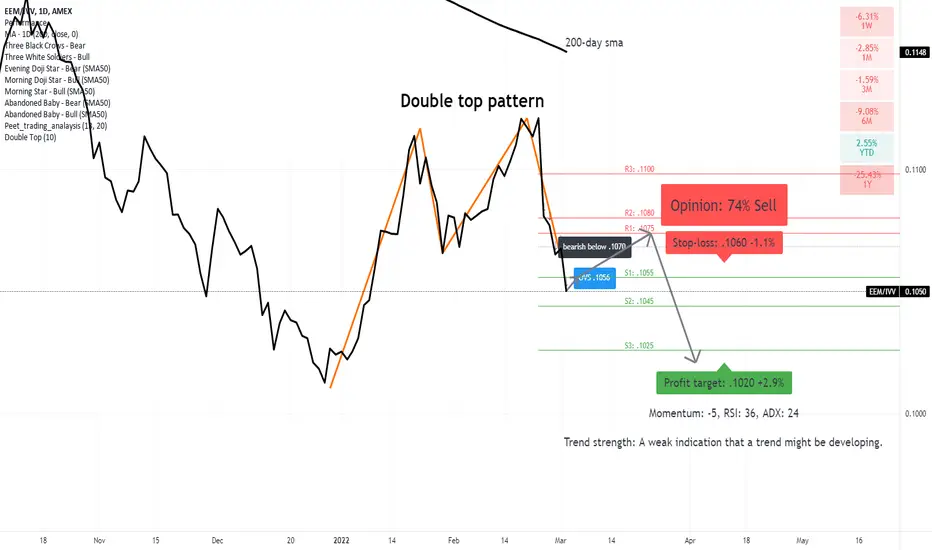
Emerging equities continue to underperform Developed equities?Below 0.1070 supports a bearish trend direction. Emerging market equities are likely to underperform Developed market equities.
Downside price momentum supports the bearish bias.
RSI leaves some room for downside potential.
Expect a pullback before the leg downwards might continue.
An M-top pattern also supports a bearish trend direction.
EEM:BIG BULLFLAG & A DIAMOND at big support zone.I think it is time for Emerging mkt to rise after falling near 20%. It has made a big flagpole & the flag is now at the 38.2% Fib retracement which is also a big support zone (45.68 to 47.50).
It had broken out of a BIG multi-year consolidation WEDGE last Jan 2021 to extend the 3rd leg of the flagpole & has re-entered inside this wedge to retest this impt support zone.
This would be the best place for EEM to reverse up. Given how big the flagpole, retracement may be limited.
Could it get lower? Possible too… as low as 41, a 61.8% retracement of the flagpole.
Any which way…wave 3 continues.
Not trading advice

Emerging Markets likely to outperform the S&P500A bullish divergence with RSI has appeared on the daily relative strength chart of EEM/SPX
Also a falling wedge has broken out upwards
A period of "Relative" outperformance wrt to the S&P500 may be near for the Emerging Markets

emerging vs. spyemerging vs. spy, the concept of mean reversion, "So it is. Everyone who is now last will be first, and everyone who is first will be last."

EM showing signs of life vs S&P500Emerging Markets are showing signs of life at least for the short term. After years of underperformance discussed in previous graphs. EM is at extreme oversold lvls vs DM and showing signs of life. A weekly close above the recent downtrend (blue line) would be encouraging for a period of outperformance with eyes on our longer term charts previously published where we made our case for EM outperformance for the next decade based on technicals and fundamentals.

EM vs. SPY...close to inflection point.Similar charts making the rounds today and reinforce our view that EM will be a better place to be over the next 10yrs. This relative value chart indicates that EM has gotten too cheap vs S&P and showing signs of being oversold and close/at an inflection point on different TA indicators. Long EM/short DM is the trade for the next 10yrs. For naked EM longs look for our other charts and lvls.

$EEM Bullish Reverse Head and Shoulders?Emerging Markets looking to me like we have put in a low with this Reverse Head and Shoulders Pattern. I've drawn in what I feel would be a proper neck line that we are over at this point. It is under both the 50 and 200 SMAs but it has regained both the 10 and 20 EMAs. I've taken a small position and my stop will be 48.80 where I would deem this idea void. Ideas, not investing / trading advice.

$EEM naked PUT, high PoP #option #trade #Trades #OptionsTrading The iShares MSCI Emerging Markets ETF is a good choice for today high IVR credit trade. High PoP, very predictable profit.
Reasons:
- high reward for Jan21 monthly expiry (mangeable with rolling) -> collecting credit
- breakeven point is far
- RSI is oversold.
Max profit: $92
Probability of 50%Profit: 84%
Profit Target relative to my Buying Power: 14%
Req. Buy Power: $633 (max loss without management before expiry, no way to let this happen!)
Tasty IVR: 104 (very high)
Expiry: 49 days
SETUP : NAKED PUT for $EEM, because IVR is high, for 0.92cr
* Sell 1 $EEM JAN21'46 PUT
Management : ROLLING if daily candle is closing below of BE.
Take profit strategy : 50% of max.profit in this case with auto buy order at 0.46db
Of course I'll not wait until expiry in any case!
If you liked this article, check my other ideas.
Anyway: HIT THE LIKE BUTTON BELOW , and for fresh option ideas FOLLOW ME( @mrAnonymCrypto ) on tradingview !

Emergin Market ETF USA Sun Storm Investment Trading Desk & NexGen Wealth Management Service Present's: SSITD & NexGen Portfolio of the Week Series
Focus: Worldwide
By Sun Storm Investment Research & NexGen Wealth Management Service
A Profit & Solutions Strategy & Research
Trading | Investment | Stocks | ETF | Mutual Funds | Crypto | Bonds | Options | Dividend | Futures |
USA | Canada | UK | Germany | France | Italy | Rest of Europe | Mexico | India
Disclaimer: Sun Storm Investment and NexGen are not registered financial advisors, so please do your own research before trading & investing anything. This is information is for only research purposes not for actual trading & investing decision.
#debadipb #profitsolutions

EEM Possible BreakdownEEM is looking weak at the bottom of this range its been in for a few weeks, if market sell of continues we may see this break below 49/48.75 which is a clear break of the channel support. Next key level below 46.25, may see sell off to this level before prior bulls come in to defend.
