EEM trade ideas


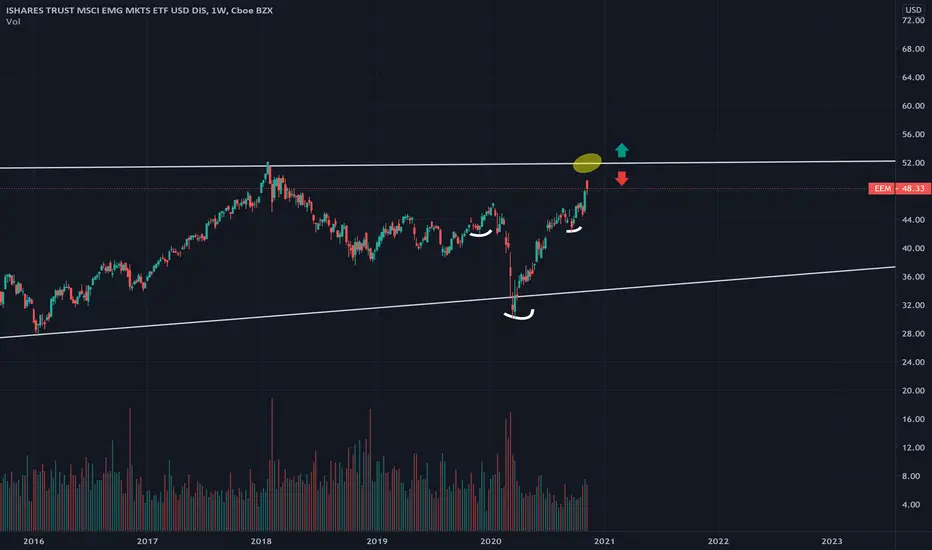
Decision time coming upWe broke out the neckline of an (albeit stretched) inverse head&shoulders pattern. Big resistance coming up. I'd go long if resistance is broken and support retested & confirmed
Cup and HandleLarge effective volume over the last few weeks. Effective volume is calculated on the 1 minute time frame
Small gap not far under price
NV and OBV show interest
Just an observation
Top 10 Holdings
BABA - Alibaba Group Holding Ltd ADR8.70%
Tencent Holdings Ltd6.65%
Taiwan Semiconductor Manufacturing Co Ltd5.66%
Samsung Electronics Co Ltd3.62%
Meituan2.02%
NPN - Naspers Ltd Class N1.29%
Reliance Industries Ltd1.20%
JD - JD.com Inc ADR1.06%
China Construction Bank Corp Class H1.01%
Ping An Insurance (Group) Co. of China Ltd Class H0.93%

EEM - Near yearly highs- The ETF has is closed to breaking the high of 2020 which should then open 52.50 as a target.
- Below 45.00 triggers a DBL top short position.
-- MANAGE YOUR RISK - -
Disclaimer: All ideas are my opinion and should not be taken as financial advice.
AMEX:EEM

Buy puts at Resistance.I will aim to buy puts at the 46.00 weekly resistance level and exit around the 45.55 daily support level. My stop loss will be slightly above the 46.00 weekly resistance level.
LETS GET IT.


Emerging markets breaking down as wellCompared to US indices, AMEX:EEM looked relatively strong in recent weeks, however, it seems that market forces taking emrging markets lower as well.
After uptrend support was broken, EEM fromed head&shoulders right at 2018-2020 major resistance and yesterday we witnessed breakdown.
Good odds at least 10% correction would be witnessed from here

End of the road for Emerging MarketsI highly suspect that #eem will go on gaining while dxy sell off is settled and enormous covid cases surging in India. Also, emerging countries will not be the first ones that recieves vaccine. I believe we are about to enter a tough 1 - 2 month for all #eem

EEM - The Perfect HedgeHello Traders,
As our followers know we remain bullish in the US equities however, there are definitely some signals that are pointing towards some more volatility.
We're not ready to short the US market just yet but as the dollar rises we want to also leave some downside hedge.
We'll be targeting EEM. Many emerging countries do not have enough dollar reserve to pay their debt. We believe that if there is any real downside to this market...the emerging market sector should get hit the hardest.
Also in terms of technicals, EEM has been creating a topping pattern and has not broken below the support line unlike other US equities. Some would argue that there is a head and shoulder pattern on the daily.
We're in this trade with a target of $42 strike by March 2021.
*NOT A FINANCIAL ADVICE, THIS IS JUST OUR PERSPECTIVE AND WE DO NOT RECOMMEND ANY TRADES WE PUBLISH ON OUR CHANNEL. YOU WILL LOSE MONEY.

End of the Road for Emerging Markets I highly suspect that #eem will go on gaining while dxy sell off is settled and enormous covid cases surging in India. Also, emerging countries will not be the first ones that recieves vaccine. I believe we are about to enter a tough 1 - 2 month for all #eem


Rising wedge break out in EEMRising wedges are supposed to be bearish, but EEM have pretty bullish look on this chart. The breakout today could be bull trap, but if we stay above the current level (ATH from April'19), the breakout would be confirmed. Looking at the chart there isn't much headroom to grow — the last 52W high is this year January's 46 level.
I'm long option call here and won't hold it beyond 46 (if we hit it).
Putting the macro hat on — the USD is falling and likely will be falling further. Precious metals are bullish. We might see a breakout above the 46-50 level, but I won't bet much on it.


EEM wave (5) resistance level Emerging Markets ETF 5 wave impulse is also carving out a wave (3) top. We are looking or the immediate wave (5) to fail into 44-46 level setting up for a wave (4) consolidation that would set the tone for EEM into Oct 20’

Emerging Markets BreakoutAs COVID-19 Cases start to ease globally, markets are responding with a breakout higher. EEM (MSCI World Index ETF) has recently broken out above its $41 resistance level and consolidating today, providing a good risk/reward for a long position. With a Weekly Chart that has broken above its channel resistance and Daily Chart breaking higher, we are targeting $44 and $47 to the upside. The trade that we are using to play this breakout with limited risk is a Call Debit Vertical Spread: Buy to Open 1 EEM Aug 21, 2020 42/46 Call Vertical @ $1.54 Debit
BUY TO OPEN Aug 21, 2020 $42 CALL @ $1.88
SELL TO OPEN Aug 21, 2020 $46 CALL @ $0.34
Click to Track Trade with OptionsPlay: app.optionsplay.com

EEM Analysis Island Bottom Reversal + 3 Inside Up + Dynamic Support + Trend Break + Bullish Momentum

EM Continuation into Overbaught Levels EM Continuation into Overbaught Levels
13:54:08 (UTC)
Tue Jun 2, 2020

Purchasing EEM calls during June.May's monthly candle closed above April's high.
If price returns to April's high, then I will begin purchasing call options at the 37.50 strike with a July 2 expiration.

#EEM My big shortAMEX:EEM
It is a debt crisis in developing countries.
Global tourism has been devastated for the whole year.
