ENPH shortSimilar to the AFRM setup I posted previously, ENPH seems to be making the same ascending wedge on declining volume. I think it will be a sharp drop to the 0.5 or 0.618 fib retracement level which should line up with the 50 day moving average by the time it gets there.
ENPH trade ideas

ENPH AnalysisThe price is in an ascending triangle. If it brokes the resistance line, we can expect to see the indicated target points.
Besides, the chart has a hidden divergence concerning the MACD indicator.

very nice breakout here🍿ENPH recently broke a 10 month downtrend resistance, and every smart investor knows.. after long consolidation we see even larger breakouts most of the time.
don't be surprised if these price targets hit in 2022!
price targets 319.84-408.05-496.26

ENPH Ceiling Break with Repeat of last previous Move $22 MoveCeiling Break to the upside of with a drop as the trigger which I would have pulled early to the top of the candle at $247 Last move went for $22 I would watch this close as its not as Bullish as the last move.
If you like these types of Ideas please like follow and Tip your bartender.
by iCantw84it
11.11.21

ENPH looks bullish using Aspen Trading S/R LevelsAspen Trading S/R Levels are predicting bullish trend for ENPH if it breaks above 238.
They already did an excellent job by identifying the support @ 143.
Please like, share and follow if you agree with the analysis.
Note - Aspen Trading S/R levels are invite only. They can be accessed through my profile information.

10/31/21 ENPHEnphase Energy, Inc. ( NASDAQ:ENPH )
Sector: Electronic Technology (Semiconductors)
Current Price: $231.63
Breakout price trigger: $222.50 (hold above)
Buy Zone (Top/Bottom Range): $225.00-$201.50
Price Target: $290.00-$293.00 (1st)
Estimated Duration to Target: 59-63d (1st)
Contract of Interest: $ENPH 1/21/22 280c
Trade price as of publish date: $8.05/contract

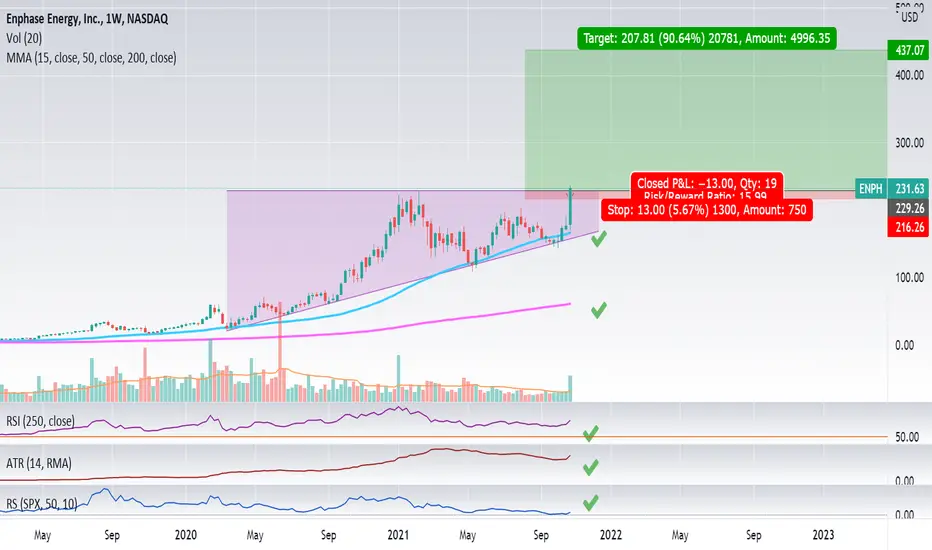
ENPH: Ascending Triangle (90%) WeeklyEMPH is another Energy stock forming into an ascending triangle on the Weekly chart.
It is not confirmed yet but the current inflation will most likely push it upward.
If confirmed:
Price target = 437.07$
Stay humble, have fun, make money!
ENPH BreakoutENPH made a breakout on Friday close
8 Month Long Base
Big earnings gap-up last week
Looking strong and most likely will see a follow-through

ENPHEnphase Energy, Inc. Trade for a period of six months. The trade will be helped to predict the rise in oil prices and, in general, for all energy carriers. The security looks like a final correction in the second wave, from where the third wave begins in terms of growth by 52% to the price of $237, which is slightly above the historical high. The price moves inside an inclined triangle, there are no patterns in the past, which increases the reliability of the trade. You can enter now part of the position in order not to miss the movement, the support levels are at $147.19 and $138.34, where you can get the rest of the position. The price of $133 is conventionally considered the stop order level, but the stop should be the end of the day stop - there is no need to place a physical stop on the market. The breakdown of the model will be if the price goes below $120.

ENPH, Large profit is ahead!ENPH has started a new up going motive wave ! how far it goes? Lets follow the analysis !
ENPH reacted well to the 0.618 golden ratio retracement of last rally labeled as wave i after a beautiful abc form of correction which formed wave ii. If true, Wave iii has started and is going to push up the stock to 294 USD. After wave iv correction upcoming wave v will even push the price more up to 319 USD to complete an Elliott wave cycle. Please note that these targets are obtained by typical Fibonacci levels of mentioned waves. Should it need any update, It will be published later.
Mentioned wave cycle is itself wave 5 of 3 of a larger cycle Elliott wave which means after completing the current cycle there will be a huge correction and another huge move up. This point shows that the general trend of stock is up and if you are a stock holder you will gain much more profits in long term. The larger cycle Elliott wave count will be published soon and added to the related link so, I refer those who want to take a general picture of the stock to that upcoming publication.
Stock newly broke the short term down trend line and is attacking the more powerful down trend line connecting two major highs. I believe every entrance strategy we choose to take a long position in this stock at the current point will brings us considerable profit. It is just the matter of risk management and maximizing profit .
It is worth to note that in terms of timing chart is a schematic drawing although I tried to make it precise by using time Fibonacci.
A trade below the last formed low makes this analysis invalid for some times and makes us to provide a minor update.
As always we emphasize, besides all these bullish signs we have to trade objectively.
Good luck my friends and

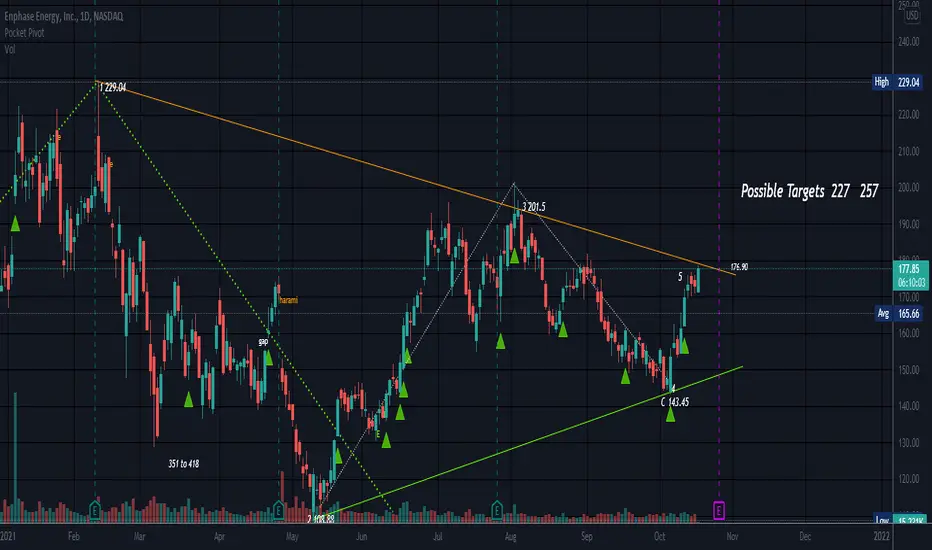
Bullish Going Into Earnings- UpdateENPH is looking really nice here heading into earnings. All previous price targets were reached and the gap on the upside has been filled. Last quarter ENPH sold off on a slight earnings miss however 9 times out of 10 they will beat on earnings. Would like to see ENPH start to outperform other solar manufacturing companies such SEDG with respect to price action- but will certainly be looking for a gap-up and breakout from this triangle. Some support and resistance levels along with some RSI-Based supply and demand levels to keep an eye on- Bullish and looking for a breakout - Previous charts are attached below - Bullish all the way
- Falling wedge on the weekly timeframe (See Chart Below)
- Flagging on the hourly timeframe (Not Pictured)
- Slight hidden bullish divergence on the RSI
- SMA's converging and beginning to curl upwards
- Symmetrical triangle on the daily timeframe
PT1- $176.03
PT2- $182.30
PT3- $189.36
PT4- $191.48
Weekly Timeframe
Previous Charts-

ENPH - Long setupEnphase Energy, Inc. is an energy technology company that provides energy management technology solutions for the solar photovoltaic industry worldwide. It engages in designing, developing, manufacturing and selling software-driven home energy solutions, which connect energy generation, energy storage and web-based control and communications management services.
ENPH has a strong buy recommendation from the analyst consensus on the Streets with a target price near the $215 mark. This also happens to be the point which the stock was unable to hold last time it broke out of the $ 200 mark, so should be a point to consider as and when price approaches these levels
From a technical standpoint, ENPH is right above its 20 Day MA and 20 Week MA. RSI in bullish zones and peaking up. Volume spike has been observed over the last few days averages and Bollinger bands on Daily charts are beginning to expand, that means sharp moves ahead.
On a break higher, expect next target $200
Hourly chart also has Bull Flag set up, could get a good swing trade near the 20 Day MA entry

Favorite Solar Stock: ENPH looks ready to goENPH is the largest holding in the Solar energy Exchange Traded Fund (TAN) at 12.21%.
Notice how it's been consolidating in the form of a weekly bull flag for ~203 days - same length of time it took to breakout in the weekly flag between 2018 - 2019. Let's see if it does it again.
I want to be long the strongest solar name.
When you take a quick look at ENPH vs TAN, you'll see it broke out in June after consolidating for over a year against TAN.
ENPH bounced off the 50 week moving average and now building well on the shorter time frame (daily and 4hr) giving me the signal to get long this today and add into it this week.

ENPH - nice post earning break-outAfter 8 months of consolidation, ENPH formed a nice cup and handle pattern with volume shrinking. Q3 earning surprise will make stock price gap up above pivot at $185 and create a nice chance to reach prior high at $230.

ENPHStrong earnings could mean the start of wave 3. Third and final ABC zigzag is possible, but not likely.

ENPH bullish analysis, Price Target $190ENPH, forming a pennant. MACD is really close to being bullish. Long term Price Target = $190

ENPH has a ton of upsideENPH looks ready to make a move to the upside. Tweezer bottom reversal pattern with bounce off trendline verified today, RSI curled upward, Increased volume and MACD ready to turn green next week. Looking for $168-$172 in the next 1-2 weeks followed by $180 shortly after.

Symmetrical Triangle Earnings 10-28 AMCPrice is at the top trendline. Long entry is a break of the trendline with an uptrend.
Symmetrical triangles are neutral until a trendline is broken and a trend is confirmed in that direction. The top trendline is resistance and the bottom is support. Retests of top trendline are common. Once price is above this trendline it can become support. Throwbacks can also occur.
If price proceeds upward in an uptrend, then possible stop below top trendline where you see support. There is a pocket pivot (green triangle) at 154ish.
There is also an ABC bullish pattern inside of the triangle.
Right now there is a bullish engulfing candle.
No recommendation
ENPH, Elliott wave count on weekly chartAs promised in previous publication , I offer here two possible wave counts for ENPH to introduce the general picture of the stock.
Left side chart:
It suggests what described in previous publication on daily time frame zoomed in current up going motive wave for smaller degree waves.
Right side chart:
Is offering an alternative scenario. Please note that the correction will be completely different in terms of price and time if this scenario happens.
Although both scenarios are , non of them violate the up coming smaller degree wave counts and it is a good news for buyers!
Larger degree wave counts can be investigated, analyzed and updated later, For now we are going to make our profit my friends.
Good luck every one . Wish you huge profits.

Falling Wedge- Bullish - UpdateBig falling wedge on ENPH here while simultaneously bouncing off the 200-day EMA, Bollinger bands are also squeezing (not pictured). Will be watching closely for a breakout and push upwards here (broader market conditions permitting)- See previous charts on ENPH below as well as charts on ICLN & TAN - Just some support and resistance levels to watch along with some RSI based supply and demand zones to keep an eye on- Bullish
PT1- $156.03
PT2- $159.33
PT3- $164.15 + Breakout
Previous Charts-
ICLN
TAN

ENPH - Above 50 SMA- BullishENPH - Crossed the 50 SMA ,bullish . Resistance at .5 pivot level.
Next target 179.
Green energy stocks are host for the last one week.

Trend continuation on the monthlyWe're also bottoming out on the weekly so we're due for a nice trend reveal play on the short term.

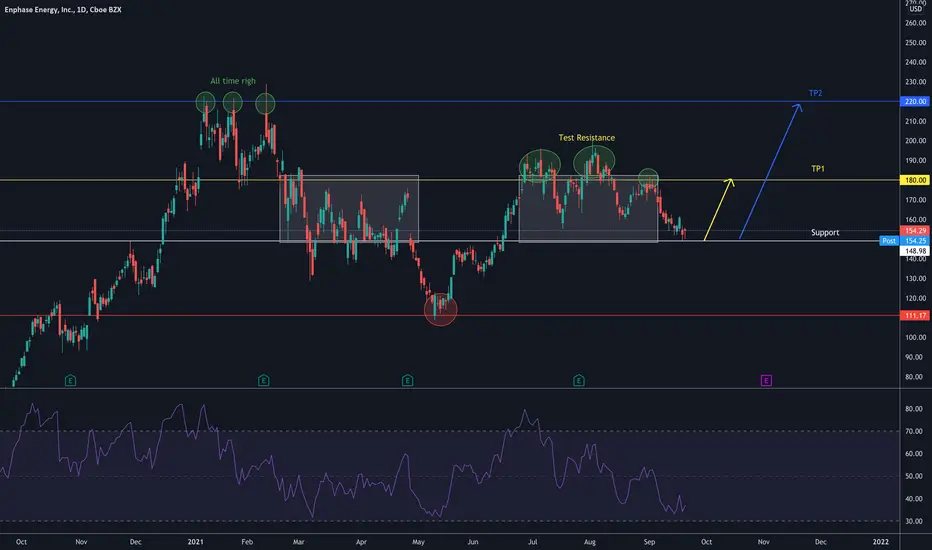
ENPH - D :: Support region :: opportunity for long termThis stock in a support region that can be a good opportunity for long term returns.
TP1 has already been tested and is likely to happen again and thats why we target 180.
TP2 is positioned for ATH price recovery.
TP1 - $180
TP2 - $220
NASDAQ:ENPH
-----------
Este stock está com preço posicionado em uma região de suporte que pode ser uma boa oportunidade de compra para retorno a longo prazo.
O TP1 já passou por testes e é provável que ocorra novamente e esse é o motivo de colocarmos o alvo no 180
O TP2 está posicionado para recuperação do preço do ATH.
TP1 - $180
TP2 - $220