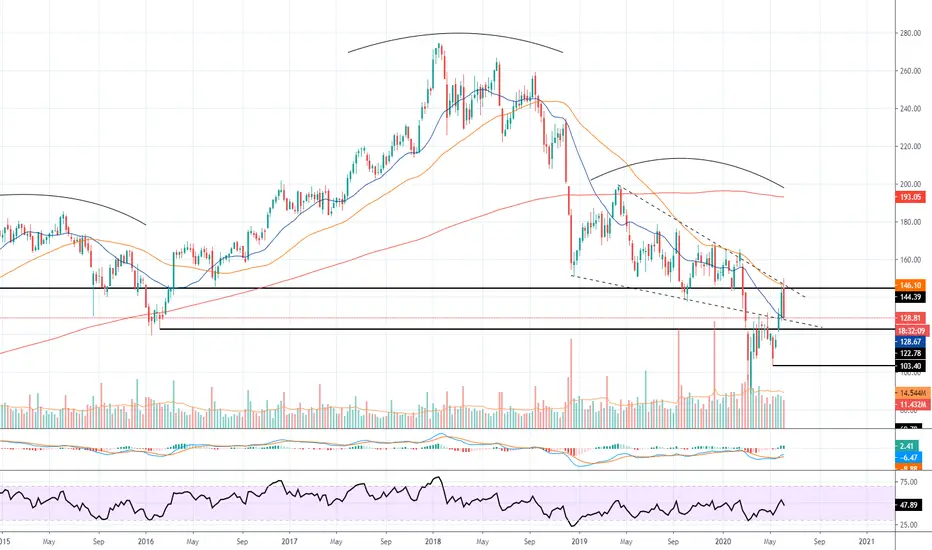
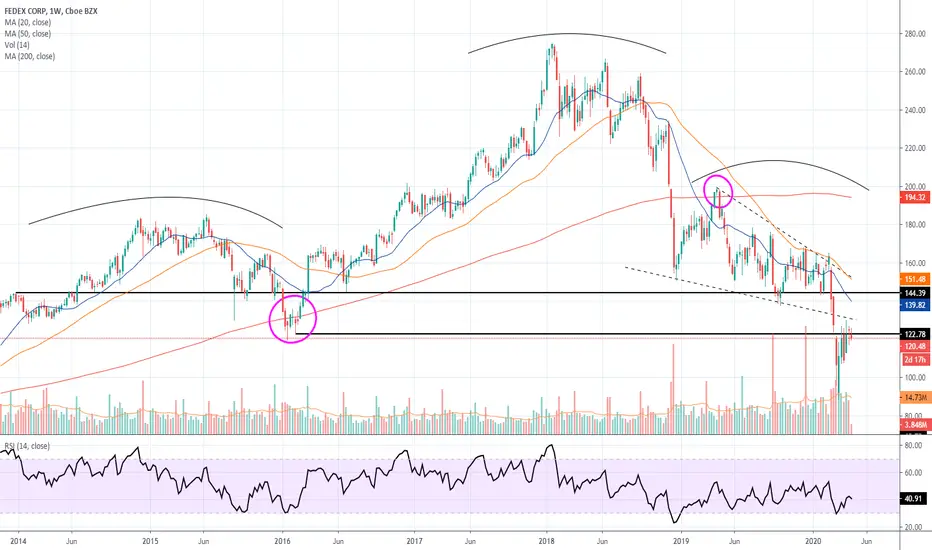
FedEx: Still room to grow. Aiming at the 1W MA200.FDX has seen enormous rise this week, breaking above the 1W MA50 (RSI = 59.573, MACD = -0.910, ADX = 28.559). Despite that, it is still undervalued both on the short and long term. Based on its recovery after the Subprime Mortgage crisis (the pattern then is very similar to today), it is aiming at the 1W MA200 on the short-term (right now at 192.71) and on the long-term to new ATH.
** If you like our free content follow our profile to get more daily ideas. **
Comments and likes are greatly appreciated.
FDX trade ideas


$FDX Fedex $165 Target short term
Possible long entry upon breaking downtrend.
Upside target to Fibonacci .382 target @ $159
Previous pivot high target $165.00
PLEASE GIVE US A LIKE IF YOU FIND OUR CONTENT HELPFUL, THANK YOU.

FDXWill see a pop tomorrow on FDX due to earnings and retrace to around $140 and continue up. I have a Bullish stance on FDX.

FDX loves the 200 EMA Zoom out further and see, best to wait for a retest and then direction before entering

FedEx shares juicy investment opportunity!FedEx, monthly chart: 14 years old(!) mirror level + 2 Hammers candle patterns + juicy sell off (fall from highs): 50%

FDX - Can we go 3/3?Hola,
Back at it again with NYSE:FDX .
Forgot to update the last idea but we took profits on 6/11.
It hit 132 like we thought!
We've got an alert at 127.5 at which point we'll start looking to enter a trade.
If that happens, we see it dropping to 120.

FDXLike basically everything else, they pushed this thing a lot farther than I thought they would before the downside would continue. Took another fakeout at the 50 sma/upper wedge line before reversing. Still think the massive head & shoulders plays out. Ultimate price target around $60.
+100% - FDX still dropping to 127?NYSE:FDX fell to 132.
We may see some green action over part of today but expect it to drop down to the 127 area if 132 cannot hold.

FDX back to 132?If NYSE:FDX drops below 142 look for it to fall $136-$139.
Those two days look weak.
Look for a drop to 132 if that support breaks.


FDXStill in a clear downtrend, but made its way back up to the 20 sma/trend line resistance. Low risk short entry here soon if it holds. Will keep an eye on it this week into next.

Fedex. Triple bottomOn the weekly TF, the “triple bottom” reversal formation is visible, the profit for which is around 19%, the formation is supported by convergence of senior TFs (month and 2 weeks).
I will try to buy at the prices pass above $ 125 (breakdown point on the figure)
Stop - the price will fall below $ 125
Profit 1 - $ 141 (MA200 day + level)
Profit 2 - area of $ 160, if the price can overcome MA200
convergences
triple bottom

Posibility to SELL FEDEX DailyHello traders, FEDEX could try to climb but it is very likely that its attempt will be a failure.
Please LIKE & FOLLOW, thank you!


FDXPosted this chart back on March 9th. Bear flagging right into previous support now after completing a head & shoulders. Weekly 200 sma acted as resistance back at the beginning of 2016 but turned to resistance at the end of 2019. Price tested the 20 & 50 weekly smas multiple times but couldn't get through & buyers eventually gave up. As long as price remains below $123, I think we see $70. Good low risk entry here.

Technical looks Good to go HigherThere is not much to comment on besides the obvious trend reversal that is taking place on the chart.
FDX could see competition from Amazon in the far future. In the mean time, Amazon's immediate misfortune is FDX's gain.
It is difficult to predict how high this will go or if the current uptrend is just a deadcat bounce. Nonetheless, this is a good entry point at $125. Any dip below $125 right now is a buy.
Can FDX Deliver? Sorry, couldn't resist!Looks like 140+ is possible, then heavy resistance at 147. Can we get there before we begin to recognize the impact of a global shutdown?
That calls for an 18% rise to 140 and a 25% rise to 147. Anybody else seeing this upside?

$90 critical for Fedex $fdx
Lets see how earnings perform and more importantly what the commentary will be.
Currently sitting on horizontal price support and Point of Control.
Major barometer of the current economy and implications of COVID-19 on commerce
