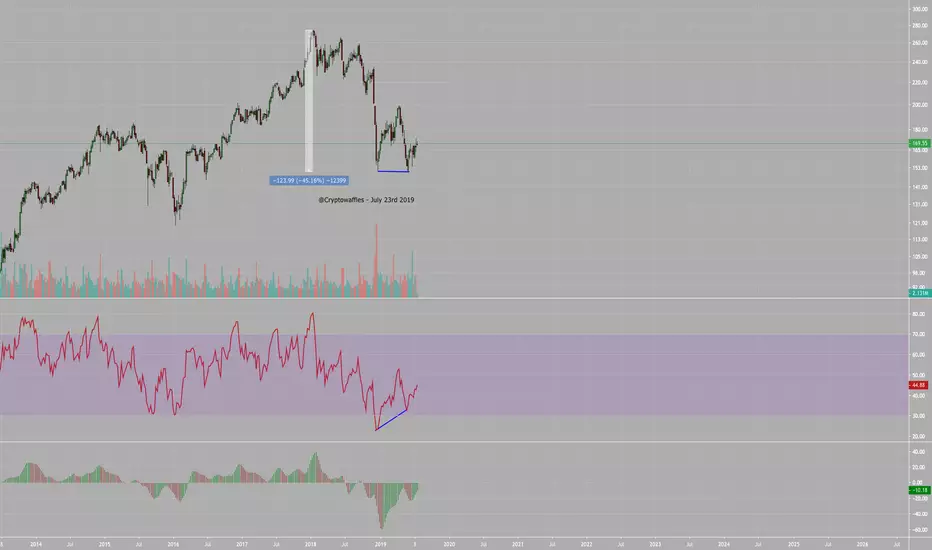
FedEx could go lower.MMHVWPI - earnings missed - retesting support. Break down and next support 124.56.
FDX trade ideas

FDX Earnings After their poor earnings release we saw price just gap down close to 15% on the open. After showing some support and testing on the current downtrend zone investors are looking for some word of optimism or relief of trade wars before going back to FEDEX as business has shown a bit of slowing down. Hopefully the holidays can boost their revenues.


FDX LONG TERM HOLDLooks like its been bouncing off the clouds for months looking to take this longterm after Hitting all time lows again
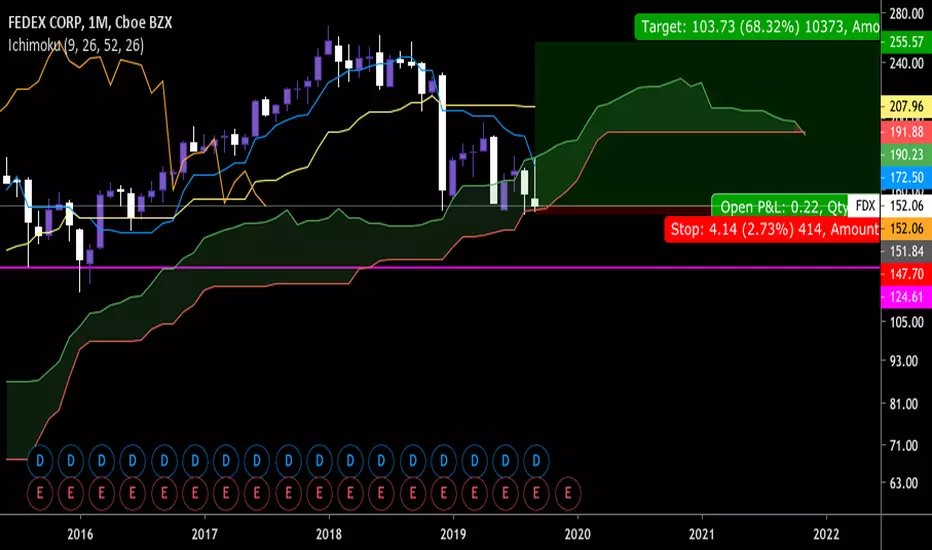
$FDX SHORTSee weekly support for possible levels at which this stock will fall to. (TP=$100)
Very weak guidance + bad earnings report + slew of analysist downgrades (KeyBanc, BMO, Deutsche, Stifel) + dropping amazon as client and now competing.
FedEx is a deteriorating company caught in global trade tensions as well as a slowing global economy.
I am short.


$FDX near the absolute downside break A break below the 149.50 is opening a wild ride into the 80-90 zone for FDX. You can sell it with the stop loss just above 155.60 level.

EMA200 Daily will send Fedex down!!!!The last cross of EMA200 was almost one year ago. Since then everytime price went close the EMA it decreased importantly. RSI levels as well are getting high and MACD stopped going up, all of them together suggest a decrease in price in the upcoming days. I will expect to see FEDEX at least at 160 by October 2019, with a Stop Loss in 181 with a R:R of 2:1 for this trade.
Good luck traders!!!!

Daily Market Report for FEDEX - Market Bounce!Strategydb believe that standardized and repetitive analysis instills discipline in trading. Reports list major areas of interest that should be considered when performing technical analysis and / or creating a trading plan.
Market Mode of Behavior: FDX : NYSE : 173.30 : Macro: Eight specific set-ups that dictate the current trading strategy...
Currently, this market meets the Corrective Bear Mode criteria. Price is trending higher.
For the entire data set this market has been in Corrective Bear Mode 11.59% of the time.
The average number of bars spent in this Mode before transitioning normally = 15. Since the current number of bars in Mode = 9, this Mode of Behavior still has 6 bars to mature before meeting its average and possibly transitioning. Remember that this analysis is being performed on the bar interval.
The average price growth during this behavior is approximately = 4.78. This is compared to the current price growth of 14.24. Based upon the closing price of the most recent bar, price growth has been exceeded.
Back to Top
Transitions & Time: FDX : NYSE : 173.30 : Macro: Background on the current Mode of Behavior...
Transition from Trending Bear Mode occurred 9 bar(s) ago.
According to our signal logic, this transition occurred normally and triggered on the shortest time frame. This TBECBE transition occurs very often. Long-term stratgies applied to this transition do well in hypothetical back-tests. Please see our disclaimer and contact us for more information.
Possessing knowledge of the preceding Mode of Behavior as well as the most likely subsequent Mode assists in executing current strategies, exits, and setups for the next trade.
Back to Top
Standard Analysis: FDX : NYSE : 173.30 : Macro: A closer look at the current Mode of Behavior...
The current bar's close at 173.30 demonstrates that prices should continue higher.
Cautionary price levels 9.58% below the market are outside the Average True Range price percentage window of 2.69%, currently lowering the short-term probability of transitioning out of Corrective Bear Mode.
The Average True Range price percentage window is simply a function of the 16 bar Average True Range, divided by the underlying's closing price of the last bar. Cautionary price levels are proprietary. Prices in this region indicate possible Mode transitions.
Volatility based on the 30 day standard deviation = 31.52%. Volatility based upon the 30 day Average True Range = 4.67 points, (based upon the underlying's price scale.)
The price change versus 1 week ago = -0.80. The price change versus 1 month ago = 14.69. The price change versus 1 year ago = 11.97.
Back to Top
Advice: FDX : NYSE : 173.30 : Macro: Straight-forward wisdom on how to position for near-term profits...
Alert! Transactions in FOREX, Futures, and Stocks, carry a high degree of risk. No slippage or commissions are included here or in our Statistics tables. Your FCM will charge you a commission.
Range trade this market from the long side. Buy dips. Do not trend trade.
During Corrective Bear Mode short time-frame traders disagree with medium and longer time-frame traders. Short-term corrective rallies are expected. (+--)
Back to Top
Natural Attraction: FDX : NYSE : 173.30 : Macro: Expected tendencies and targets...
During Corrective Bear Mode prices should tend towards a point located at 180.15.
Back to Top
Support & Resistance: FDX : NYSE : 173.30 : Macro: Specific trading levels or bands...
SPEEDVIEW TRADING WIDGET
A key level to watch, located at 172.73 is exactly 0.57 points, or 0.3% away.
Trading Band6 Level = 182.36
Trading Band5 Level = 177.70
Trading Band4 Level = 173.03
Trading Band3 Level = 168.37
Trading Band2 Level = 163.70
Trading Band1 Level = 159.03
Back to Top
Price Growth / Decay Projections: FDX : NYSE : 173.30 : Macro: Growth / decay projections...
Target#1 Hit @ 174.61
Target#2=191.17
Distance=17.87
Move=10.3%
Back to Top
Common Technicals: FDX : NYSE : 173.30 : Macro: Values for commonly used technical analysis indicators...
Macro = Daily Bars...
Momentum Indicators
09 Day RSI = 68.86
10 Day RSI = 67.57
14 Day RSI = 63.45
Moving Averages
003 Bar MA = 173.66
004 Bar MA = 173.62
005 Bar MA = 173.69
008 Bar MA = 171.25
010 Bar MA = 169.34
014 Bar MA = 165.57
018 Bar MA = 162.78
020 Bar MA = 162.21
030 Bar MA = 161.12
040 Bar MA = 163.35
050 Bar MA = 163.76
100 Bar MA = 165.64
200 Bar MA = 173.54
Oscillators
12,26 Day MACD = 3.61
9 Day Smoothed MACD = 1.71
Difference = 1.90
Volatility
20 Period Bollinger Bands +2 Devs = 177.46
20 Period Bollinger Bands -2 Devs = 145.45
Wilder Parabolic Stop and Reverse
ParabolicSAR = 154.37

FDX buy setupFDX’s innovation outlook is trending up based on a current score of 73 out of 99, outperforming sector average. Jobs growth over the past year has decreased and insiders sentiment is negative. FDX is an Average Performer in terms of sustainability. It is most exposed to Airbus SE as its supplier. Over the past 4 quarters FDX beat earnings estimates 2 times and it pays dividend lower than its peers.
For more analysis and articles visit our website .

Rejected by the 200ma / previous High I bought I 150 & 155 puts due to up coming earnings. So My idea here was since amazon and fedex split up this summer their profit would be lower despite only 2% of revenue was reported from Amazon fulfillment. Along with that their previous earnings P/L report was extremely low. Ending up with me being over all bearish looking for a 10-15% drop during eranings.

Golden Cross imminent in FedEx pre-earnings. AVERAGE ANALYSTS PRICE TARGET $180
AVERAGE ANALYSTS RECOMMENDATION OVERWEIGHT
SHORT INTEREST 2%
COMPANY PROFILE
FedEx Corp. is a holding company, which engages in the provision of a portfolio of transportation, e-commerce, and business services. It operates through the following segments: FedEx Express, FedEx Ground, FedEx Freight, FedEx Services, and Corporate, Other, and Eliminations. The FedEx Express segment consists of domestic and international shipping services for delivery of packages and freight. The FedEx Ground segment focuses on small-package ground delivery services. The FedEx Freight segment offers less-than-truckload freight services across all lengths of haul. The FedEx Services segment provides sales, marketing, information technology, communications, customer service, technical support, billing and collection services, and certain back-office functions. The Corporate, Other, and Eliminations segment includes corporate headquarters costs for executive officers and certain legal and finance functions, as well as certain other costs and credits not attributed to the company's core business. The company was founded by Frederick Wallace Smith on June 18, 1971 and is headquartered in Memphis, TN.


FDX Price crossed 10 day EMA with RSI ConfirmationBack to basics Trend Trading. If the 10 EMA crosses the 50 moving average we may see an even bigger move.
BOUGHT 10 FDX-COMB @ 2.73 on 9/4/2019


FedEx updatePrice currently at the uptrend line, which was confirmed. Also 50% retracement level. With recent earnings disappointing and news came out today that there will be no renewal deal with Amazon at the end of this month.
While it is a good level for a buying opportunity, the stock seems to be more on the sell side for now. Major banks like Morgan Stanley and JP Morgan gave it a 'hold' rating and a price target of $143 and $173 respectively.
So far, higher probability is that this stock will go lower, so maybe best to wait for the next support if this one breaks and buy then. Or short the break of the current 150 support level. Good Luck!


FDX reversed from resistance, potential drop!
FDX reversed off its resistance at 169.49 where it could potentially drop further to 159.20.
Trading CFDs on margin carries high risk.
Losses can exceed the initial investment so please ensure you fully
understand the risks.


FDX approaching support, potential for a bounce!
FDX is expected to drop to 1st support at 169.76 where it could potentially react off and up to 1st resistance at 159.20.
Trading CFDs on margin carries high risk.
Losses can exceed the initial investment so please ensure you fully
understand the risks.

