FDX trade ideas


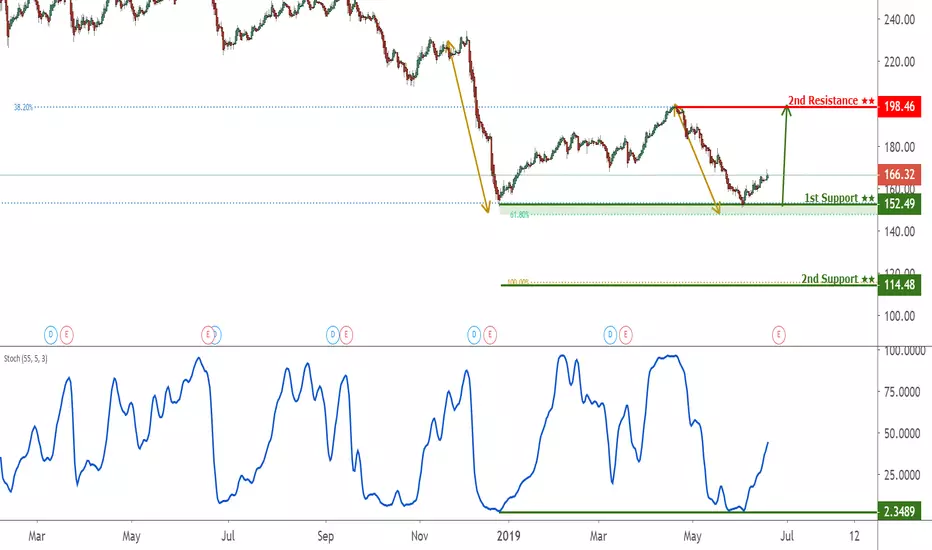
FedEx short Decline will meet support at $150. If it goes below, TP $116.62.
Risk if it holds at support, possibly double bottom, and begin upward trend. In that case, possible resistance and new TP at $198.
Watching closely for post-close movement following 6/25 earnings. Expecting disappointment and subsequent drop.


TO MANY UNKNOWNS TO RISK TRADING FEDEX PRE EARNINGSThe transports and Fedex are having a very poor 2019 and investor sentiment is quite negative toward the entire sector. This is one of the most eagerly awaiting earnings report of the quarter as it could paint a very gloomy
picture regarding the world economy. In the past Fedex have not been shy to spoil the party with very negative commentary during the earnings call. last year's second and third quarter reports were the beginning of the of the correction. It is also noteworthy that AMAZON will be a hot topic for discussion, as analysts grill management into the reason and consequences in cutting ties with amazon on air freight.


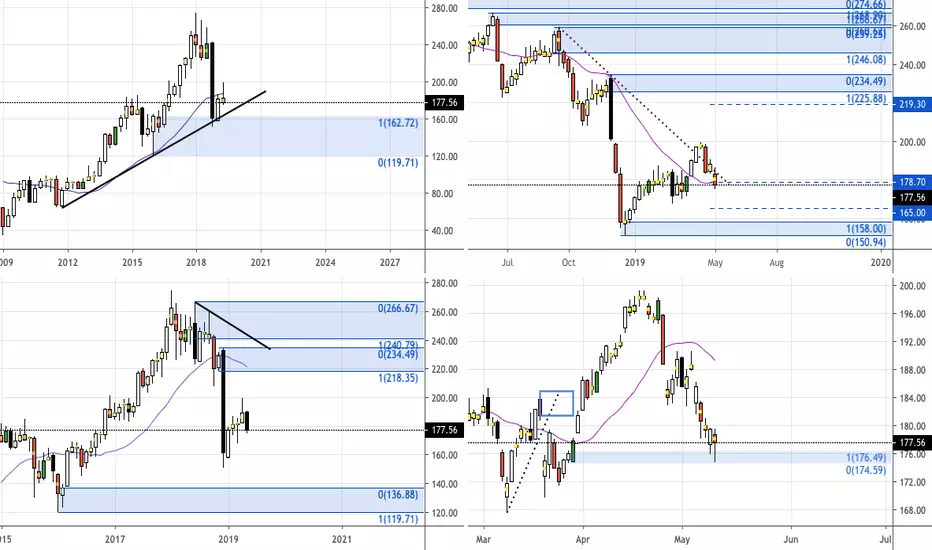
It's a kind of magic"FedEx Stock Hits a New Low on China’s Wrongful Delivery Probe" - that's the headline from Market Realist.
It draw my attention and I opened the chart.
At first sight we clearly see the vertical fall in the wave 3, and a number of smaller impulses at the reversal (top of the chart).
A bit confusing unless you draw the trend line, that had been broken.
Absolutely clear structure as marked in a minute.
125 bucks seems to be a fair bargain.
Good luck!


My main stock of my watchlist today June-03-2019Good Morning, today my main stock on my wathlist will be NYSE:FDX , we are below all major averages, below VWAP and we broke 2 very important trendlines, i will look for a fade on the break of pre-market lows after the market opens, all the way down to 145 area, i will never trade pre-market, i prefer to wait and confirm my edge, remember this is a probability game, good luck today!
*Only for educational purposes*


Dow Transportation Stocks .. Breaking Down AgainDow Transportation stocks are down sharply today,
signaling potential renewed weakness ahead for the US economy
with one of the leading stocks in the group Federal Express (FDX)
busting it's chart wide open to the downside. ( Shown Here)
Weakness in the trucking and airline stocks can be seen across the board today,
with the Dow Transportation Average breaking down, to a new chart pattern low.
One should always pay attention to the signals that the Transportation Average
is giving, as it often is a quantified leader in judging future economic strength or weakness.
The signal that it is giving today
is that the market is clearly sensing
an economic slowdown caused by the China trade war
could easily be in the cards,.. for the US economy later this year.
THE_UNWIND
5/22/19
NEW YORK

FDX daily cypher pattern long opportunity (Video idea)Life is not only about trading but also about English speaking practicing lol.
This is my 1st try for an English video idea, as this set-up is so good that worth a shot!
I'll be waiting for the 161-162 spot to long, and I would take this trade without leverage and take it as a 7% risk trade!
Let's see how it goes yo!