FEDEX, swing, pullback or reversal? The price has done a few lower highs, and perhaps it will continue to bounce at the SMA50.
FDX trade ideas

Federal Express Corporation 1971–1997 FDX CorporatAs for the coming holiday-shortened week, it tends to be a good one for stock investors. The S&P 500 has risen between Christmas and New Year’s Eve on 73% of occasions in its 94-year history, with a median return of 0.7%, according to Dow Jones Market Data.
That could cut the S&P 500’s 2022 loss, currently at 19.3%. There’s another historical trend in investors’ favor. When the index declines 20% or more in a calendar year, it’s been up two-thirds of the time in the next year, per Dow Jones Market Data. The following 12 months have seen a median gain of 24.3%.

$FDX with a Bullish outlook following its earnings #Stocks The PEAD projected a Bullish outlook for $FDX after a Positive over reaction following its earnings release placing the stock in drift B with an expected accuracy of 50%.


FDX Price Analysis (Short to Long Trade Idea) FDX Analysis:
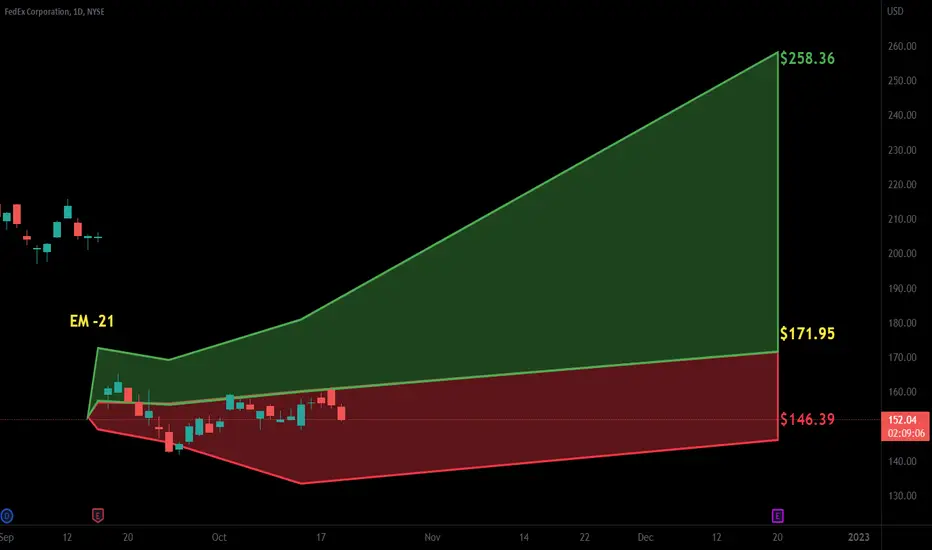
On Feb 16th Sep. 2022, FDX sold off massively to create a huge gap ranging from $164.36 to $201.93. Before beginning a move back to the upside to fill this gap, FDX first dropped to a major demand zone at $132.83 - $141.26 which was also in confluence with the monthly chart 200 MA/EMA. It then ranged between $147 - $160 from the beginning of October to the beginning of November before finally breaking the 164.36 mark to begin the larger gap fill between $164.36 - $201.93. After the breakout, FDX began to consolidate in a rising wedge while partially filling the gap midway before rejecting the weekly 20EMA at 182.40. As of now, FDX has broken below this rising wedge and is retracting to retest lower timeframe supply area to either create a head and shoulders pattern or maybe even a close double bottom (lower higher). Dec 9th, 2022 daily candle attempted to test this area and rejected it while also rejecting the 9EMA on the daily.
Trade Idea:
We are watching for a small move up to retest the supply area, hopefully getting a touch of the support line (short green line) at the rising wedge to show that it has turned resistance (Note: This area of interest is marked by the red circle). This would be ideal because we would get a better entry closer to the stop loss with more confirmation and a better risk/reward. Just in case, watch for a continued move down below $170.08.
We are looking to enter a short term put swing to target to the support area between $161.80 - $164.36 and the intermediate uptrend line (larger green line) for a take profit (NOTE: This take profit area is marked by a yellow circle. After this play, we are watching to see if we can get confirmation for a bounce at this area for a continuation not only to the upside to fill the rest of the gap between $182.40 - $201.93 but to also get a 5th touch of the major downtrend area (large downward slanted red lines). So basically that will possibly be another trade opportunity in the near future.
SN: FDX has earnings on Tuesday, Dec 20th 2022 which would we be key in the watch the reaction at that support zone (green area below rising wedge) and intermediate uptrend (upward slanted green lines). ALSO NOTE, there is a strong resistance/supply area above between $189.30 - $195.33 which is a crash course with the 200MA/EMA on the daily timeframe. This could be where we see price meet supply, the 200MA/EMA, and the major downtrend area (large downward slanted red lines).

FDX FedEx Corporation Options Ahead Of EarningsLooking at the FDX FedEx Corporation options chain, i would buy the $125 strike price Puts with
2023-6-16 expiration date for about
$8.12 premium.
Looking forward to read your opinion about it.


FDX daily hammer at support level buying zoneOrder BUY FDX NYSE Stop 155.27 LMT 155.27 will be automatically canceled at 20230401 01:00:00 EST
FDX daily hammer at support level buying zone. Stop loss below local low pivot, take profit into 50% Fibonacci retracement.

$FDX with a Bullish outlook following its earnings #Stocks The PEAD projected a Bullish outlook for $FDX after a Positive over reaction following its earnings release placing the stock in drift B with an expected accuracy of 33.33%.
FDX BUY++++ Way oversold!Purchased more calls, further out $150 Nov 4th calls. FDX should bounce to $175 and can go down to $141 ish support after breaking $152 support. Way oversold, false bear flag.
$FDX continues with a bullish signalA few days ago I made a 5% profit, I sold and today I see another chance for FDX to continue its course higher, we'll see...
Thoughts?
Control your own risk.

KINDA BEARISH IN THIS ONE $FDX I believe FDX is going lower as per my analysis. I will keep it updated to see how it goes.
I will go long for whenever the chart tells me we're done with A wave.

$FDX Underperforming major cycle looks complete, underperforming SPX similar to 86-92 period , trendline support and prior 4 key ..

#FDX 5% profit executedThe confirmation to enter happened when the SSL Channel showed an uptrend and the second confirmation came with the MA21 crossing below the candles.
Simple but effective patterns and indicators.
Control your own risk.

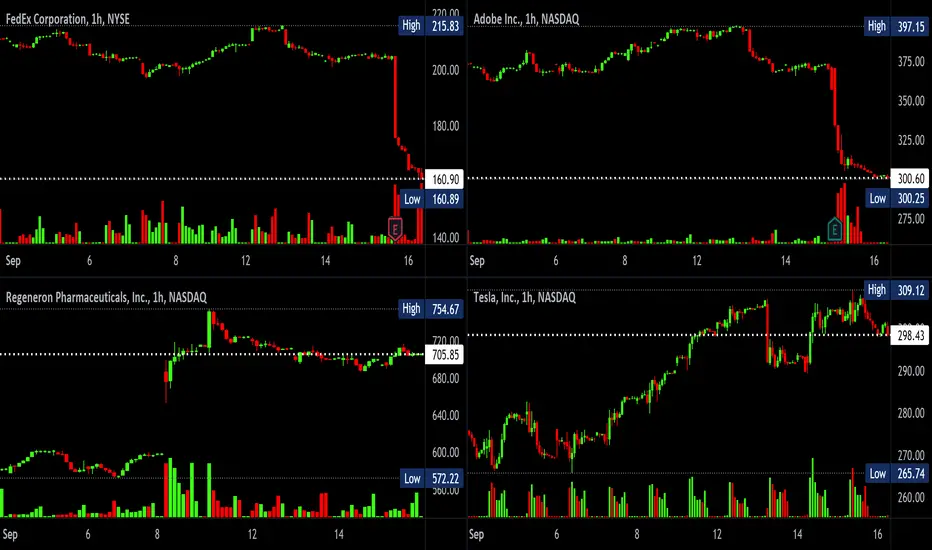
September 2022 winners and losersSeptember 2022 winners and losers. Here's a short list of 4 companies that have gone up or down a lot the past 2 weeks. Now that we all know what happened leading up to Quadruple Witching 9/16, the question is what tickers will be the big winners and losers for the rest of September 2022? Feel free to drop a line with your future ideas.
September 2022 - to date:
FDX
high = $215.83
low = $160.30
ADBE
high = $397.15
low = $300.00
REGN
high = $754.67
low = $572.22
TSLA
high = $309.12
low = $265.74
Do your own due diligence, your risk is 100% your responsibility. This is for educational and entertainment purposes only. You win some or you learn some. Consider being charitable with some of your profit to help humankind. Good luck and happy trading friends...
*3x lucky 7s of trading*
7pt Trading compass:
Price action, entry/exit
Volume average/direction
Trend, patterns, momentum
Newsworthy current events
Revenue
Earnings
Balance sheet
7 Common mistakes:
+5% portfolio trades, capital risk management
Beware of analyst's motives
Emotions & Opinions
FOMO : bad timing, the market is ruthless, be shrewd
Lack of planning & discipline
Forgetting restraint
Obdurate repetitive errors, no adaptation
7 Important tools:
Trading View app!, Brokerage UI
Accurate indicators & settings
Wide screen monitor/s
Trading log (pencil & graph paper)
Big, organized desk
Reading books, playing chess
Sorted watch-list
Checkout my indicators:
Fibonacci VIP - volume
Fibonacci MA7 - price
pi RSI - trend momentum
TTC - trend channel
AlertiT - notification
tickerTracker - MFI Oscillator
www.tradingview.com
FDX Put Credit SpreadFDX Put Credit Spread
11/18 Expiration (51 days).
----{current price: $145}----
$115 short put
$110 long put
$458 risk : $42 reward. 11:1.
Short strike allows for 20% down.
e.g.: Five contracts = $210 in premium, $2500 in collateral.

FDX Iron Condor Idea for 11/18 ExpirationUgly risk:reward ratio but seems like a SAFE bet. Good to watch if nothing else.
FDX Iron Condor Idea
11/18 Expiration (51 days).
$270 long call
$260 short call
----{current price: $145}----
$100 short put
$90 long put
$960 risk : $40 reward. 24:1.
e.g.: For 5 contracts: $200 premium and $5,000 collateral.
Short strikes allow for 80% up and 30% down.

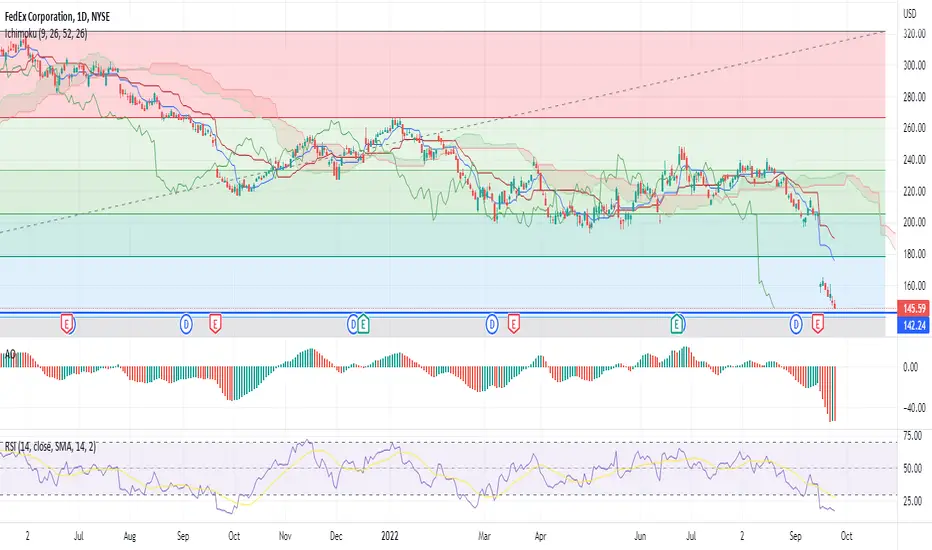
Fedex Slammed in SlowdownFDX is one of my favourite bellwether stocks to show economic strength or weakness. The month stochastic is showing overs old but price can still push down to support.

FDX still a BUY++++ oversold and overdoneFDX very much oversold on many indicators and time frames. Bounce back to $175!!
Fedex Corporation weekly AnalysisHello Ladies and gentelmen, according to my graphical analysis of Fedex Corporation, there is a high probability of a decline, in the next few weeks!

SHORT | FDXNYSE:FDX
Possible Scenario: SHORT
Evidence: H&S, Price Action
TP1: 198$
we are in a bear market, and it formed H&S in weekly and monthly charts, so it is very reliable. PUTs for the next 60 days will print. it's in the oversold territory now, so a rally based on technical is very possible, I'll open a position with 30% of allocation and I'm ready for averaging up/down
*This is my idea and could be wrong 100%.

FDX BUY $152 for bounce back to $175FDX oversold and overdone. I would be looking to buy at long term support of $151.50 for a bounce back to $175. Why is anyone surprised by the ER and guidance withdrawn lol

FedEx measured in SilverFedEx break down in progress versus silver.
Silver will need to price in the required monetary imbalances needed to nominally save FedEx (& US equities).
The longer & deeper FedEx goes, the more rocket fuel for silver is being filled in it's tank.
#fintwit #silver #fedex #fdx
