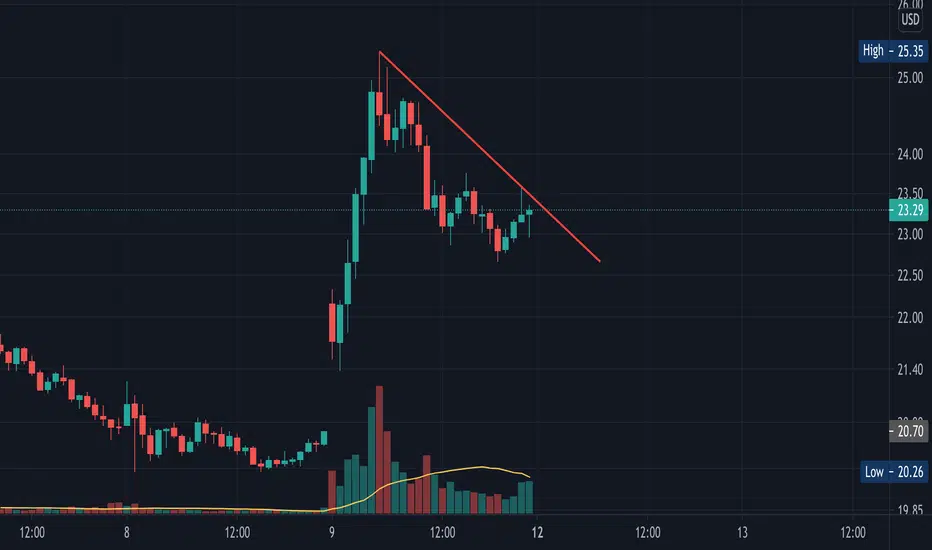
FUBO breakout is imminentLooking for FUBO to breakout of this wedge to the upside tomorrow and possibly make a big move and retest resistance around 22.92.
FUBO trade ideas

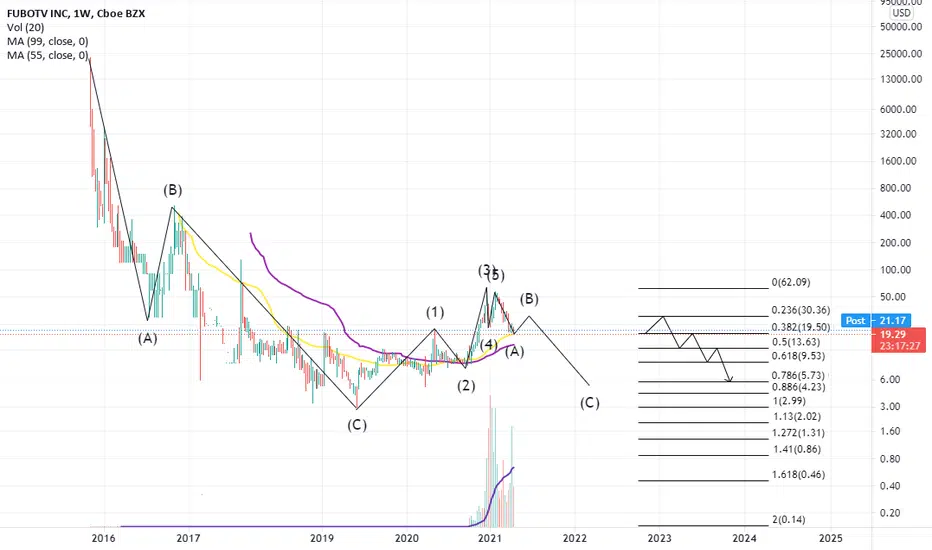
FUBOMID-TERM: Close to a bullish crab, bounced at the 2.618, which was also an iceline. Classic bullish divergence already confirmed on daily, but developing on 4hr. (not financial advice)

Fubo could have a positive reaction to 55 day moving averageI've been hoping that Fubo remains above the 99 days moving average and doesn't get bearish cause I saw Fubo for the first look a bat but today I see a crab!
crab harmonic pattern:
CD=1.6 XA=$6.7
or
CD=2.6 BC=$5
or
CD=3.6 BC=$2

$FUBO - good buying opportunityFUBO baby is consolidating around the 200SMA for a while. Strong support around the $21 and also look at the VOLUME on 4/9!!!


FUBO - At rock bottom Based on long term support, FUBO is due to rally 60% to its target resistance.

FUBO | Lots of bag holders will provide resistanceHey all
The idea is that FUBO has created a deep range of bag holders around the 27 - 28$ mark, which will probably provide for strong resistance in the days to come.
I would like to see the name retest a double bottom around 20$ before taking a long position.
Any thoughts?
Good luck to all!
(*This is not financial advice, for sake of discussion and illustrative purposes only*)


FUBOFUBO - NEUTRAL
- FUBO currently at a major decisive point.
Scenarios:
Long:
- Bounced off of .786 Fib
- Giant Volume Candle on the daily
- Possible ignition of trend reversal (to the upside)
- Look to enter long if a 30m candle closes above $25, target Point of Control at 28. Might move higher to .618 fib at 29.50
- Bottoming out action present chart
- Bottoming out at over-sold area of RSI
Short:
- Bounced off of upper channel of down-trend
- Look to enter short if a 30m candle closes below 20.42
- Lots of room to go down further if 20.42 support breaches, profit target at 14
Overall: More bullish signals than bearish.

FUBO flaggingFlagging after a gap up. I like the closing volume so going to watch this one for another breakout.
double bottom then the ripFUBO looks like its about to reverse here, nice move today, will be on watchlist

$FUBO RECAP AND BREAKDOWN! SQUEEZE?Quick recap on last weeks trade and where we are at on the daily.$FUBO

Wait Worldcup 2022, looking to upside
FuboTV popped 12.7% Friday after the sports-focused streaming service announced a deal for the exclusive rights to a major set of soccer matches.
Price supported by 200D MA.
Break and closed below recent low @ $20, the bear will continue.
Resistance. $26/$30

FUBO TV - Possible pump! World Cup 2022 partnership with Fubo. Nice catalyst. Oversold and needs atleast a relief bounce so this news should drive it.

Highest daily volume ever /Finally we see a reversal in RSI trend line even though I am not sure if this is a valid indicator.
Combined with highest daily volume .
Combined with news regarding football broadcast announcement.
All indicators look to have a higher price next week.
All comments /critique are welcome . I am trying to learn.

FUBOA move on Fubotv Inc (NYSE:FUBO) above $26.2 could spark a nice short-squeeze next week. Looking at the technical daily chart there are several indications I see which suggest a potential bottom formation, including large positive divergences on MACD in daily. If the potential buy signal confirms itself, we will be looking for a move to the resistance area at $33.3-34.72, at the very least. Until that happens, traders will want to be on high-alert to the possibility of a bullish reversal. Long setup on watch.

Fubo potentialLargest buy volume in charts history this past Friday. 600% above average and 25% higher than previous biggest volume. Bounced off of 0.764 fib and 200dma. Looking for a run to next horizontal resistance that coincides with the 0.618 fib (29-29.50). Small pull back before a run to 35. This is major horizontal resistance and would complete the head of a potential inverse head and shoulder. Would expect pullback to 29ish before run back up.
This is all potential- but volume is a great indicator and Fubo has large bullish catalysts coming its way. It can fast and hard.
Imo it has moved down too hard too quick off of fund liquidation and a skewed earnings report that showed eps being worse than what it really was. Looking for a strong rebound.

$fubo Fubo with the largest buy volume in the charts history this past Friday. 25% higher than previous high volume and 600% the average daily volume. Bounce off the 0.764 fib. Next horizontal level of resistance is approx 29-29.50. Also coincides with the 0.618 fib and is a major volume node. That’s target 1 where I would expect small pullback as people take profits and bag holders get out even. 35 would be the next major target which would complete the head of a potential inverse head and shoulders. Pull back to 29-30 would be expected.
Large catalysts ahead for this name with sports betting coming.

FUBO Maybe Targeting Above 32 After Acquiring Streaming RightsWith the latest news that FUBOTV has acquired the exclusive live streaming rights to the Qatar World Cup 2022 Qualifying matches of the South American Football Confederation, CONMEBOL, the stock price may now be ready to touch 32 (and above)
-N.B
- Let emotions and sentiments work for you
-ALWAYS Use Proper Risk Management In Your Trades


$Fubo good news and technical situationFubo tv acquires Acquires Exclusive Streaming Rights for South American Qatar World Cup 2022 Qualifying Matches
in plus the chart highling some important information that will lead the price to rise.
The price is bouncing on the border ( see main chart)
the orange area (good for entering at lower prices ) started on MTF pressure indicator ( the center chart )
the positive daily buyers pressure are incresing (chart below)
I'm buying at this price.
