GME 9/19/2022Daily chart analysis.
Adding to existing trade.
After rejecting higher prices and falling back below resistance @ 37.95, price broke thru and fell below minor support level at 29.00.
Price has pulled back to support at 29.00 and looking to turn it to resistance.
Price currently at area of value. Cue to enter.
Adding to existing trade
Entry: 28.60
Stop loss: 22.20
GME trade ideas

GME: CTB on the rise can price go back up to $40?Hey everyone,
As always not financial or sexual advice. That being said, every time the CTB rises drastically there has been a sharp increase to the upside in price.
March 15-24th 2%-22% increase of ~153%
May 19-25th 8%-50% increase of ~64%
July 21-22nd 32%-124% increase of ~ 20%
Dec 19 - Present 8%-27.7% increase of ???
Fibs suggest a downside of $18.40 and $17.61.
Good luck!

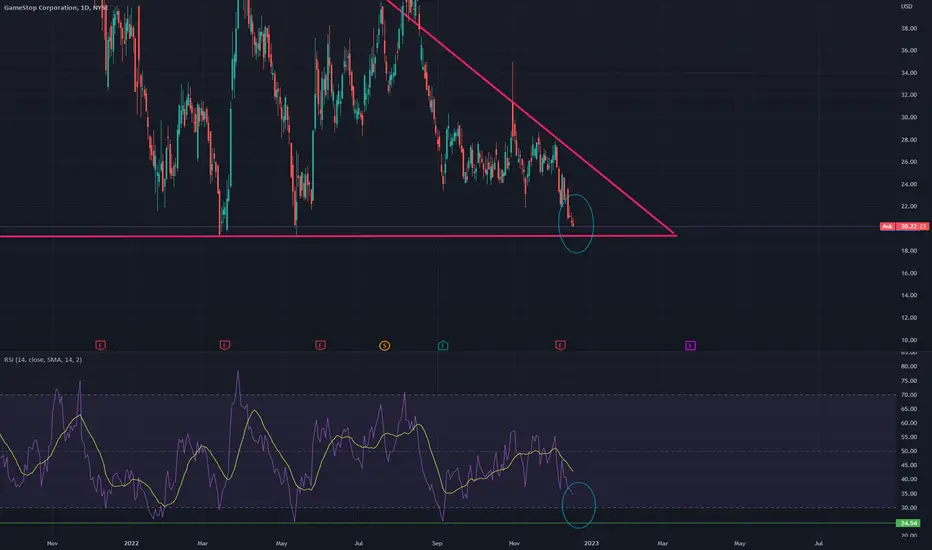
GME - Falling wedge getting tighter
The 18-month falling wedge is getting tighter and tighter. If you believe in the stock, then I´d wait for a break of the wedge´s top trendline.
When falling wedge´s break, I usually have 2 initial targets:
- the middle of the wedge
- the wedge´s starting point (its top)
These targets would already give a major upside gain... but again: if you believe in the stock.

$GME - Turned Bullish, but what about the rest of the market?GME is looking super good today. Shorts increased their positions by another $25mil which is extremely bullish for GME in terms of making the price increase/run or whatever you want to call it. It looks like the run is happening after all.
You need to however take the rest of the market in consideration before getting too happy.
For the past few cycles, GME has done it's thing into a bearish market. One example was when CPI/FOMC was on the exact same day as a run (twice actually) and the run got crushed. Another example was when AMC gave out it's dividend 1 day before the GME run and 1 day after the GME run was the TSLA split. There were plenty more instances where GME just did it's run into a dying market.
EOD Data
-Looking at the EOD data for GME, as i said things are looking super bullish. A run is going to happen for sure.
-Looking at the rest of the market, i'm not sure what's about to happen e.g i can't tell. If the rest of the market does not die starting tomorrow, the run should be a good one and would touch in my opinion $40 for GME. If the rest of the market starts dying tomorrow onwards, i think GME could make a new low at $17.xx.
Positions: SPY Puts, AMD Puts, Coca Cola Puts.
I could've kept my GME calls but i'm not feeling this one even if the GME data is clearly saying things are bullish. This means #1, i'm a week early and #2 you're all about to get rich. So, good luck. I really hope GME doesn't get pumped whilst the market is dying for whatever random sudden news comes out tomorrow...
TLDR:
-Data says GME go up for sure.
-I'm not feeling it, so i think it's going to $17.xx
Data is almost always right, i'm alost always wrong. Cheers.

$GME - Load up, a lotMy previous target of $19.40 ish is almost there. The biggest loading zone is here. My entire port is now on GME calls.
No PT from here, i only know that $19.4 is an extreme support. If broken by a lot and for more than 1-2 days, god save us all.

$GME - Load up, only a little bit...My data doesn't indicate a run for GME this time.
I'm thinking there's a possibility of a run on 21 Dec -+1 day as usual. The only indicator i have to rely on that might support this is the idea that the market always pukes on or until SPY Dividend dates (16 Dec) and then starts to recover immediatel the week after. There are some exceptions where the dump on SPY dividends can last +1 week thus ruining any hopes for a rally.
I'm hedging my SPY puts with GME calls and SPY calls for the moment. Not fully hedged, only partially buying GME and SPY calls because i'm not sure whether next week will be a thing. Need to see today's and Monday's EOD data for that. Needless to say, GME's resistance is at $19.4 and that's where you should at least load up a bit or even from where we are right now. Anything below this resistance and i would personally consider completely removing this stock from my watchlist at this point since there's more easy places to make money at.
Don't go all in on calls, if you have puts, keep them and only buy a handful of calls. There's 0 guarantee for anything happening next week. I'll update this post once i have more data and if the data indicates anything good.
Load up when
RSI is oversold
GME is below $20
That's my opinion
Daily Falling wedge on GME has just entered the Discount ZoneLooking at this Falling wedge on the daily, a breakout of this wedge could be substantial and shoot this stock back into the 40s with ease. SI is on the rise as is IV, Also SMC showing GME has just entered the Discount zone and grabbed a pretty big block of liquidity. Prem zone on the Daily is sitting in the $43 dollar range.

GameStopped. Ryan Cohen fleeced retail Ryan Cohen is a con man. He fleeced investors. This stock really sucks

Where are all the shares Kenny? Wow how absolutely wrong I was, looking back at all of this time, effort and money... I've been having a hard time swallowing the truth of this squeeze play being a nothing burger for the past 2 years so far.
With that said, my conviction on this play has not changed whatsoever. No, that is not supposed to be an inspiring statement at all for us shareholders (we have been railed so far) it is just the purest truth. I am not giving up nor will stop buying shares, I will continue accumulating over the time that passes by, there has been too much DD and investigation of the fraud currently taking place in the market and especially on this ticker to roll over. I'm calling this bad call as it is, being wrong, but this play WILL eventually come to fruition and squeeze from the massive amounts of short shares floating around in this oblivion we call a "Market". They have not covered, that's the only thing that matters to me.
GME will either crash down to 10$ here or start its run back to test that 35$ area then 50$ etc. I still have every call I've purchased so far this journey (leaps), along with every share, I have not sold a thing.
To all the people/bears telling me that I was wrong, well yes, that seems to be true at the moment. Lets just remember though before you have your victory lap... it hasn't ended yet. Tread carefully...
Happy Holidays.

Gamestop (GME)GME is still on the bearish momentum, no clear entry for BUY. Rechart upon reaching 19.65 level.

GMEI knew the earnings reaction was a fluke but either way it's still hard to trade that. Looks like price finally wants to move down. I'm not shorting here but will be looking for another area to load up puts. For now, watching permabulls lose their shit on every bearish post I make on this stock is satisfying enough.

Game longGME is good value based on its book value relative to its share price (6.06x), compared to the US Specialty Retail industry average (8.76x)
GME's cash and short-term investments ($1.04B) can cover GME's cash burn for the next year ($405.90M), even accounting for increasing cash burn (88.51%
GME's short-term assets ($2.58B) exceed its short-term liabilities ($1.59B)
GME's short-term assets ($2.58B) exceed its long-term liabilities ($488.80M)
GME's cash and short-term investments ($1.04B) can cover GME's cash burn ($405.90M) for at least 1 year
GME's revenues are forecast to grow faster (6.23% per year) than the US Specialty Retail industry average (4.67%)
GME's revenue growth is accelerating - its growth over the last year (1.29%) is above its 5-year compound annual rate (-6.03%)
That's an increase of almost 8%
GME has gotten more efficient at generating Return on Capital (-30.27%) compared to 3 years ago (-39.13%)
Over 80% of GME trades are buys (long)
However the price remains low.
There are concerns about price manipulation.
Logic, in a normal.market if 80% buy and 20 % sell the price would climb, not decline.
The downward trading seems to be done of exchange, in dark pools.
investopedia.com/terms/d/dark-pool.asp
GME is transforming to a tech company that will enable gamers to own assets that they buy or earn in games.
They also created a market place for those items which has grown to be the second biggest marketplace within months.
as we experience the shift towards Web3, DeFi apps including NFT, Marketplaces are headed for more growth and with that experts have predicted that NFTs will continue to gain value.
Nft is one of the ways players will have ownership of their assets.
Global videogame revenue is expected to surge 20% to $179.7 billion in 2020, according to IDC data, making the videogame industry a bigger moneymaker than the global movie and North American sports industries combined.
And all those players will be able to buy and sell their in game assets.
Opensea is the biggest marketplace ATM. The GME marketplace is faster, 200% cheaper, already has many integrations and partnerships with Nintendo and Sony among others.
Its a long play, the development of nft and the marketplace take time.
With the current turmoil in crypto and the recession we should be patient.
But if GME manages to end on top, and they have been working hard and with results to show for it, the valuation would be in the 30 to 40 billion range.
At anything below 30 its a bargain.

$GME - The bottom's inPositions: imgur.com
Suffered minimal losses accumulating this position so far since i was hedged and mostly entered at around 21.96 levels and kept repositioning lower and lower.
As apes who bought calls at $25 and $26 close their calls with -90% loss, this stock is going to bump back to $25-$26 levels as long as the market does not crash tomorrow (which is a real possibility, SPY $380-$386 and VIX/UVXY Pump. IV is quite high right now with 1 hour left to close and earnings ahead. Probably best to get in with shares and not with options.
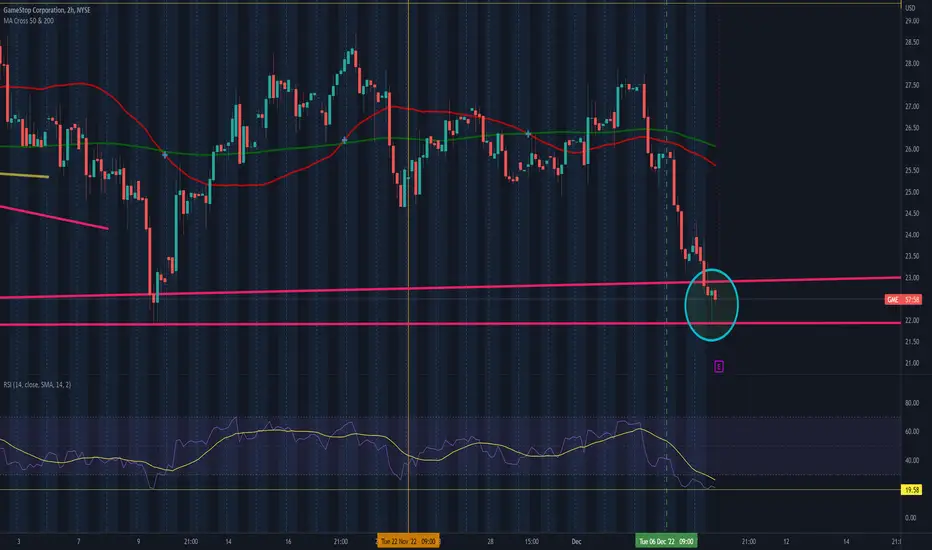

GME no clear buy entry as of nowNO clear BUY entry for GME now, WIll wait to 19.65 if all indicators align. With all negative, its a no BUy for this time.

GMEMissed the $24 break on this. Earnings tonight. Probably sees sub $20s after if I had to guess. Only a matter of time before weekly demand zone is tested at ~$13.

$GME - Dec 6 RunIt's simple, just like my previous posts.
This has nothing to do with earnings or fundamentals. It's purely a market mechanic trade.
The delta from expiring/exercised/rolled monthly expiring options from the end of the month will always hit the market on the usually first Tuesday of the next month.
Dec 6 is the date where lots delta will get settled due to last month's expiring options & from Nov 22's failed sucker rally options.
Would rather not over-share the method to this at this point. Just look at my previous posts on $GME and decide for yourself. When bashing for whatever reason at least please keep the language civil in the comments.
At the same time here's a screenshot of something and no explanation what it is or a direction prediction so that i can appear cryptic and smart like others do. imgur.com
Jk imgur.com Dip before the rip on the 6'th probs will be caused by today's CPI thing.
Keep in mind that this even is market wide but it only manifests as 1 sudden big spike on very few stocks. Some of the other stocks i'm analyzing with the method i analyze say that this is the bottom whilst GME says there's another dip spike before the 6'th. I've decided to ignore this dip and i've gone ahead and bought risky options not GME but another stock with a similar but even better setup that i believe will spike even higher than GME on this run. I won't be posting my position in said other stock here not to get inversed by highly regarded folk.
Regardless, there's money to be made on GME.
The safe space is with 9 Dec 24c's (-100% or +200% return)
Mixed Risk is: 9 Dec 24c's & 29c's (-100% or +450% return)
Yolo / LFG: 9 Dec 29c's (-100% or +800% return)
Stay safe. There's mixed signals on the data i'm seeing whether there will be a dip before the rip in the next few days or today. I'm betting there won't be one, but i'm a fool. A good trader would wait for that dip.

GME 21/24/28 Broken-Wing Put ButterflyRange-Bound Pullback Set-Up:
Since about early September GME has been range bound between 29 and 24. The entire market was down for the month of September, yet this traded range bound in this area. But towards the end of September, it tightened it's range bound between 27 and 24 and trending lower at a slow pace. With the big green day we had in the markets Thursday after CPI and another green day on Friday, this really didn't move as much. If the range is getting tighter and trending lower, we could be setting up to head lower in the 21-24 range. Which is why I had the idea of a Broken Wing Put Butterfly which can work great in these range bound set ups.
In order for me to put this trade on, I need to see this trade below were today's candle ends up. Because as of now, it's looking like a reversal candle at the area of resistance. So I'll have to check this tomorrow before executing my trade. As far as stops, I'll be position sizing with max loss. If the market decides to head higher the rest of this month and GME decides to follow the general market, this could make it's way back to another resistance point of 29ish. If by the end of this week it gets to 29, I'll want to see a reversal candle at 29, before I decide to get back in another trade.
Trade Set-Up:
No trend. It's making relatively equal highs/lows. The 20-day & 50-day SMA's are flattening out as well. I've established that resistances for this particular trade idea is 27 and support at 24. This small rally has brought the stock back up to resistance level and a reversal candle is currently forming.
T.E.S.T.
Timeframe: 3 weeks. I'll have a December 2nd expiration date.
Entry: If this trades below todays possible reversal candle, my entry will be right around 26.
Stop: I'll be positioned for max loss.
Target: My target is 24.
Profit Score:
Potential- 2
ATR- 2.18
Score- 0.92
Stock Outlook: 0 to -1
Trade Breakdown:
Chart Set-up is Range-Bound and consolidating.
Entry: I'm going to sell the December 2nd 24 strike and buy the December 28 and 21 strike. There are no earnings scheduled until December 14th so stable volume is anticipated.
Position Sizing: This should be a Net Debit of about 3.10ish by tomorrow if it does fall to 26 tomorrow. I'll be setting up for max loss and only risking 2% of my portfolio.
Trade Management: A week before this expires expires I will analyze the trade to determine if I should close out the position before expiring. If this falls below 24 before December 2nd and looks like it wants to run back up to 24, I might want to hold this to expiration to close out near the apex of the trade.

Gamestop earnings tomorrowGamestop Q3 October 2022 earnings are tomorrow 12/7 at 4:05pm. GME has been trading in a $24-29 range since it's last earnings. It's basically been a consistent long at $25ish or short at $28ish since then. Will this 3-month ranging pattern change this week? I guess we'll soon find out tomorrow. Here's a GME 4hr chart with current levels:
R3 = $29.32
R2 = $28.45
R1 = $27.58
pivot = $26.71
S1 = $25.84
S2 = $24.97
S3 = $24.10
Do your own due diligence, your risk is 100% your responsibility. This is for educational and entertainment purposes only. You win some or you learn some. Consider being charitable with some of your profit to help humankind. Good luck and happy trading friends...
*3x lucky 7s of trading*
7pt Trading compass:
Price action, entry/exit
Volume average/direction
Trend, patterns, momentum
Newsworthy current events
Revenue
Earnings
Balance sheet
7 Common mistakes:
+5% portfolio trades, capital risk management
Beware of analyst's motives
Emotions & Opinions
FOMO : bad timing, the market is ruthless, be shrewd
Lack of planning & discipline
Forgetting restraint
Obdurate repetitive errors, no adaptation
7 Important tools:
Trading View app!, Brokerage UI
Accurate indicators & settings
Wide screen monitor/s
Trading log (pencil & graph paper)
Big, organized desk
Reading books, playing chess
Sorted watch-list
Checkout my indicators:
Fibonacci VIP - volume
Fibonacci MA7 - price
pi RSI - trend momentum
TTC - trend channel
AlertiT - notification
tickerTracker - MFI Oscillator
www.tradingview.com

GME GameStop Options Ahead Of EarningsLooking at the GME GameStop options chain ahead of earnings , i would buy the $30 strike price Calls with
2023-1-20 expiration date for about
$3.00 premium.
If the options turn out to be profitable Before the earnings release, i would sell at least 50%.
Looking forward to read your opinion about it.

NYSE: GMETest BUY @24.00 to 27.00 LEVEL . Wait for the earning report on 07 Dec 2022. Will it breakout after a long consolidation period or will it breakdown after the earning report date? For me I'm bullish on this if it breakout. ---Coach Macph

15 Min Symmetrical Triangle on GMEA breakout out of this Symmetrical triangle could drive GME back into the high 30s possibly 40s not to mention witching just around the corner.

GME ShortIn downtrend, bounce back to Supply Zone
Earning 9/14/2022 Estimate -1.66
Short 145
Stop 157
Target 90
Risk management is much more important than a good entry point.
I am not a PRO trader.
In my trading plan, the Max Risk of each short term trade should be less than 1% of an account.
