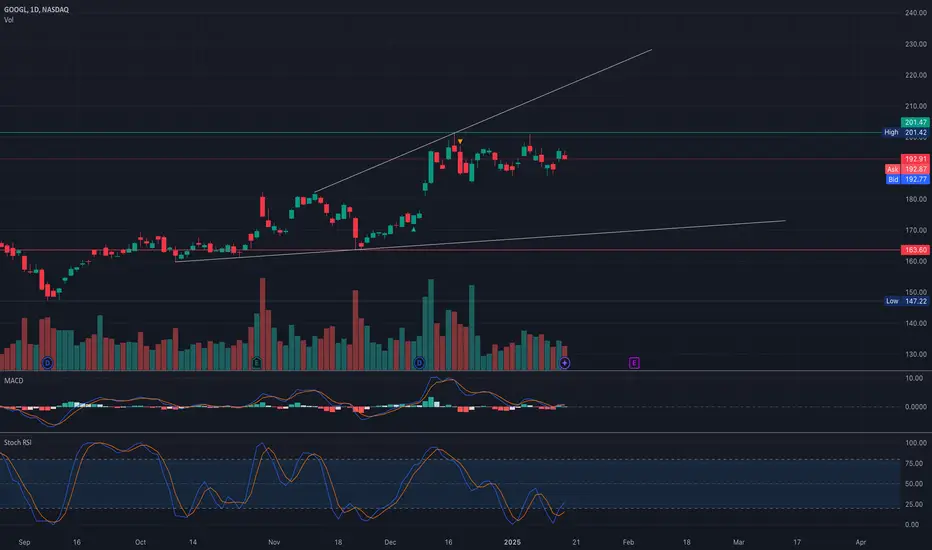
GOOG - Divergence ~$167 & $178There is a clear divergence between price and momentum (RSI) on the daily chart.
The ~$178 and ~$167 levels are key areas where I anticipate the correction could bottom, potentially marking the start of a new upward move.
GOOG trade ideas

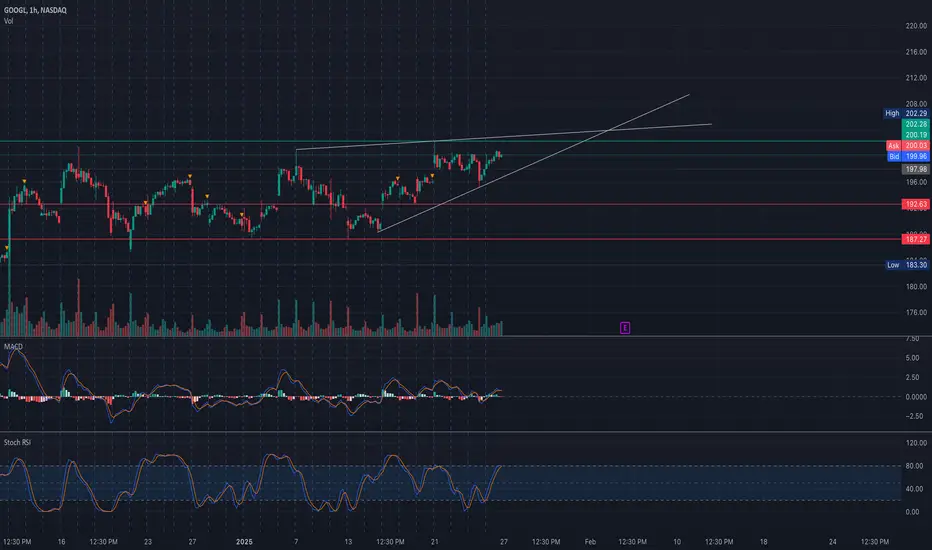
GOOGL at a Key Inflection Point! Trade Setups for Jan 23 Analysis:
Google (GOOGL) is currently trading near a critical resistance level at $200, which coincides with the highest positive Gamma Exposure (GEX) and a significant psychological round number. The price action suggests a potential breakout or rejection scenario.
Technical Observations:
1. Trend Analysis:
* GOOGL is forming an ascending triangle pattern on the hourly chart, indicating bullish consolidation.
* Higher lows reinforce buying pressure.
2. Key Levels:
* Resistance: $202 (recent high and 3rd call wall)
* Support: $192.5 (major support level and put gamma wall), $187.3 (next key support)
3. Indicators:
* MACD: Shows a weak bullish crossover, suggesting momentum is building but not yet decisive.
* Stochastic RSI: In the overbought zone, hinting at potential short-term exhaustion.
4. Volume Profile:
* Increased volume near $200 suggests significant market interest at this level.
GEX Insights:
1. Call Walls:
* Key Call Levels: $202 (3rd call wall) and $205 (2nd call wall). These levels act as resistance where call sellers might hedge, amplifying upward movement if breached.
2. Put Walls:
* Key Put Levels: $192.5 and $185. These serve as support levels where put sellers may defend prices.
3. IVR and Options Activity:
* IVR: 53 (indicating above-average implied volatility).
* Options Flow: Call volume dominates with 27.6% skew, highlighting bullish sentiment in the short term.
Trade Scenarios:
Bullish Scenario:
* Entry: Break above $202 with strong volume.
* Target: $205 (next resistance) and $210 (longer-term resistance).
* Stop-Loss: Below $198 to minimize risk.
Bearish Scenario:
* Entry: Rejection at $200-$202.
* Target: $192.5 (support) and $187.3 (next key level).
* Stop-Loss: Above $203 to limit losses.
Actionable Suggestions:
* Monitor price action around $200-$202. A decisive move above or rejection will define the next direction.
* Keep an eye on options flow. Increasing call open interest near $205 may signal bullish continuation.
* Be cautious of overbought signals from the Stochastic RSI.
Disclaimer: This analysis is for educational purposes only and does not constitute financial advice. Always do your own research and manage your risk before trading.
GOOG is going for the GAP fillAfter the HAGOPIAN, I expect price to go for the GAP fill, which is at the L-MLH.
Maybe a partial fill is the right way to take profits. Because if price open & close outside the L-MLH, we can expect further downside.

gollgle long bestGoogle has been consolidating past few months now earnings coming an d pelosi loading google with a ascending triangle breakout makes google a perfect recepie to buy
I will be a buyer at this level. Only megacap that has not broken its 2023 highs

Major Price Movement Incoming for GOOG!Signalist has detected a precise pattern in NASDAQ:GOOG trading activity, signaling that a substantial price movement is imminent. This isn’t a random fluctuation—it’s a carefully analyzed precursor to a significant market event.
📅 What to Expect:
⌛ Timeline: Anticipate a major move within the next 1 to 4 upcoming 3-hour candles.
📈 Monitor the Charts: Keep an eye on GOOG’s price action over the next few candles.
Prepare Your Strategy: Whether you’re bullish or bearish, have your trading plan ready to capitalize on the move.

GooglShort anything near 200.. stop loss above 205...
Looking for that 175 gap close or wedge support by earnings or from earnings ..
Rising wedge here
And once support breaks you will see googl at 116

Google Short: Completion of 5 wavesThe chart shows how I think the waves have played out for Goog (and Googl). The last 5 waves (in green), is an ending diagonal, which explained the overlapping waves.

GOOGL Trade IdeaPrice today was rejected at a 1.618 Fibonacci level. I entered a successful short position and intend to get back in for another day trade.
Since it previously reacted to a Fibonacci level, it may continue to do so.
The 1.618 for Fibonacci 2 happens to be the start of Fibonacci 1, which is also a previous high/resistance point.
Price is already headed down.
I'm looking for an entry based on a 50% retracement from a Fibonacci on the 5 minute chart, which I have since deleted.
The target is the 1.618 Fibonacci level for Fibonacci 2.
KEY:
-White Horizonal Lines: Previous High or low/resistance level.
-Fibonacci Retracement: I've removed all the levels except 0, .50, 1, 1.618, and 2.618.

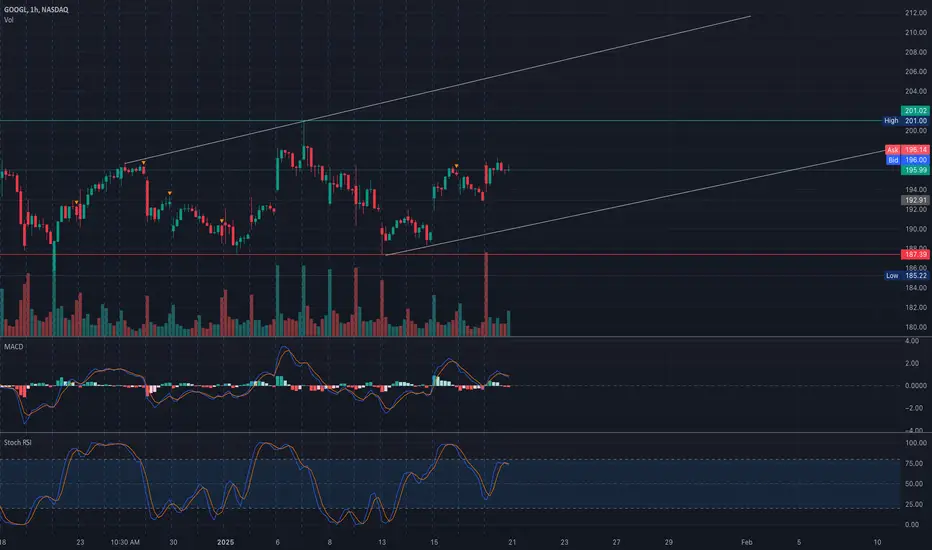
GOOGL Approaching Key Resistance! Watch for a BreakoutAnalysis:
Alphabet Inc. (GOOGL) is trading near the critical resistance zone of $200, forming a potential rising channel. Recent volume spikes suggest heightened interest, while the MACD and Stochastic RSI indicate mixed signals. The MACD is neutral with minimal momentum, while the Stochastic RSI is entering overbought territory, signaling caution for bulls.
The price is consolidating near $196-$197, a level with strong gamma resistance, which will likely dictate the next major move.
Key Levels to Watch:
* Resistance Levels:
* $197.50-$200: Immediate resistance zone and gamma wall.
* $205: Extended target if $200 breaks with momentum.
* $210: Long-term channel resistance and high GEX level.
* Support Levels:
* $192.50: First support aligned with HVL and key gamma positioning.
* $187.50-$185: Strong downside support zone.
GEX Insights:
* Gamma Exposure (GEX):
* Significant positive GEX at $200 indicates strong resistance.
* Downside GEX support levels are at $192.50 and $185.
* Options Activity:
* IVR: Moderate at 47.7, suggesting elevated implied volatility.
* Call/Put Ratio: Bullish, with higher call interest near $200.
Trade Scenarios:
Bullish Scenario:
* Entry: Break above $200 with increasing volume.
* Target: $205 (first target), $210 (extended target).
* Stop-Loss: Below $195.
Bearish Scenario:
* Entry: Rejection near $200 with bearish price action.
* Target: $192.50 (first target), $187.50 (extended target).
* Stop-Loss: Above $201.
Directional Bias:
The bias leans cautiously bullish due to the upward trend and consolidation near resistance. A breakout above $200 would confirm strength, while a rejection could lead to a retest of lower support levels.
Disclaimer: This analysis is for educational purposes only and does not constitute financial advice. Always do your own research and manage your risk before trading.
GOOGLE - Trade Analytics InsideNASDAQ:GOOGL looking like a SNACK! 🤤
🔹Green H5 Indicator
🔹Triangle breakout
🔹Bullish Wr%
🔹Volume shelf launch
🎯$203🎯$217 before March! ⏲️
Not financial advice

Google (GOOGL): Bullish Reversal in Play – Eyeing $237 TargetBullish Engulfing and Fibonacci Channel Support
Last week’s green candle on the weekly chart of NASDAQ:GOOGL has engulfed the main body of the previous red candle, signaling a potential trend reversal. Moreover, the price has respected a key support level within the Fibonacci channel, further strengthening the bullish sentiment.
Key Observations:
Fibonacci Channel:
The stock is moving well within an upward Fibonacci channel, indicating a healthy uptrend.
Current support is holding at the midline, confirming buyers' interest at this level.
Bullish Candle Formation:
A clear bullish engulfing candle pattern has formed, a strong reversal signal.
Upside Potential:
Based on Fibonacci extensions and channel resistance, the next major target lies at $237, offering a ~20% upside from the current levels.
Moving Averages:
The price is trading above key moving averages (20, 50, and 200-week), reinforcing a strong bullish outlook.
What to Watch:
Volume confirmation will be crucial to validate this move.
Keep an eye on the support at $173.96 and $167.59 (short-term MAs) to manage risk effectively.
💡 Trade Idea:
A breakout above $196 could provide a clear signal to ride this uptrend. Consider trailing stops as the stock approaches $237 to lock in gains.

$GOOGL $GOOG - What do you think?NASDAQ:GOOGL NASDAQ:GOOG if this cup and handle plays out, it could reach $225. 👀
As always, I share my opinions and trades. I’m not suggesting anyone follow my trades. You do you.

The Ecstatic 3 Step System: The Glow Of Google Price ActionGoogle stock is one of the tech companies that is going to recover
during this market downturn that we went through
Now look at the MACD indicator in this
chart you can see that the price is undervalued
this is the best time
to buy a stock price
also if you look at the candle stick pattern
it is very much near the new high breakout position
Now there are many ways to find
these kinds of patterns
That is why you have to develop your
own strategy but that doesn't mean
i won't share with you how i began learning
about technical
analysis you see in the beginning i could
not even recognise the chart patterns
And so i had to master this strategy
thanks to M. Kratter who wrote
the book “Rocket Stocks” which you
can find on Kindle Amazon library
i mastered this strategy
and i developed my own strategy
which i call the rocket booster strategy
this strategy has 3 steps which are:
The price has to be above the 50 EMA
The price has to be above the 200 EMA
The price should rally up or break out
The last step is very very important
because remember you are looking for that
rally upwards.
Also notice that the RSI below has crossed meaning the buyers
already won the market price war
before this breakout that is above to happen.
Rocket boost this content to learn more
Disclaimer: Trading is risky you will lose money
whether you like it or not please learn risk
management and profit-taking
strategies
also, feel free to use a simulation
trading account before you
trade with real money

GOOGL Consolidation at Key Levels! Trade Setups to WatchAnalysis:
GOOGL has entered a consolidation phase, trading within a tight range near $190-$195 after a strong run-up. The stock faces overhead resistance at $197-$200, as indicated by strong call walls in the GEX data. The MACD is neutral, suggesting indecision, while the Stochastic RSI shows oversold conditions, indicating a potential bounce is possible.
Volume remains relatively muted, emphasizing the consolidation. However, a breakout or breakdown from the current range could set the stage for the next directional move.
Key Levels to Watch:
* Resistance Levels:
* $195-$197: Strong resistance zone aligning with the highest call walls.
* $200: Psychological barrier with significant gamma resistance.
* Support Levels:
* $190: Key support level for the current range.
* $187.50-$188: Strong GEX put support.
* $182.50: Final downside support and critical zone to hold.
GEX Insights:
* Gamma Exposure (GEX):
* Positive GEX levels dominate near $197-$200, suggesting strong resistance to upside moves.
* Negative GEX levels around $188-$187 provide key support zones.
* Options Activity:
* IVR: Moderate at 48.7, reflecting manageable implied volatility.
* Call/Put Ratio: Calls are relatively lower (19.3%), indicating bearish skew.
Trade Scenarios:
Bullish Scenario:
* Entry: Break above $195 with increasing volume.
* Target: $200 (first target), $205 (extended target).
* Stop-Loss: Below $192.
Bearish Scenario:
* Entry: Break below $190 with selling pressure.
* Target: $187.50 (first target), $182.50 (extended target).
* Stop-Loss: Above $193.
Directional Bias:
Neutral to cautiously bearish, as the stock remains range-bound with strong resistance overhead. A decisive break above $195 or below $190 will likely dictate the next trend.
Actionable Suggestions:
* For Scalpers: Trade the $190-$195 range until a breakout or breakdown occurs.
* For Swing Traders: Monitor the $187.50-$200 range for breakout/breakdown opportunities, aligning with GEX resistance/support levels.
Disclaimer: This analysis is for educational purposes only and does not constitute financial advice. Always do your own research and manage your risk before trading.
Bearish Way for $GOOGL (End Of Jan)Bearish Way for NASDAQ:GOOGL (End Of Jan)
185 is Target for GOOGL in End of Jan, Do you think so ?

GOOGL Tests Key Levels! Can Bulls Break Through?Technical Analysis Overview:
1-Hour Chart:
* Trend: GOOGL is recovering from a recent pullback, now testing resistance near $195.50.
* Indicators:
* MACD: Shows bullish momentum slowing as the histogram shrinks.
* Stochastic RSI: Overbought at 96.69, suggesting a potential pullback or consolidation.
30-Minute Chart:
* Price Action:
* GOOGL has rebounded off $190 support and is approaching resistance at $197-$200.
* Volume has picked up during the move, supporting bullish activity.
Key Levels to Watch:
Support Levels:
* $190: Immediate support zone.
* $187.50: Strong support aligned with the HVL and PUT support.
* $182.50: Next support, close to the 2nd PUT Wall.
Resistance Levels:
* $195.50-$197: Key resistance, aligned with the 2nd CALL Wall.
* $200-$202.50: Major resistance zone, coinciding with the 3rd CALL Wall.
GEX Insights:
Key Gamma Levels:
* Positive Gamma Walls (Resistance):
* $197: 94.54% GEX (2nd CALL Wall).
* $200: 69.41% GEX (3rd CALL Wall).
* $205-$210: Higher resistance, marking extended upside targets.
* Negative Gamma Levels (Support):
* $187.50: Significant support (-2.03% GEX).
* $182.50: 2nd PUT Wall (-0.94% GEX).
Options Metrics:
* IVR: 50.2, indicating moderate implied volatility.
* IVx: 33.5, slightly below average.
* Call/Put Bias: Calls dominate at 16.8%, reflecting a bullish tilt.
Trade Scenarios:
Bullish Scenario:
* Entry: Above $197 with volume confirmation.
* Target: $200-$202.50.
* Stop-Loss: Below $190 to limit risk.
Bearish Scenario:
* Entry: Rejection at $197 or breakdown below $190.
* Target: $187.50-$182.50.
* Stop-Loss: Above $200 to minimize losses.
Directional Bias:
* GOOGL’s move toward $197 suggests bullish potential, but overbought conditions and resistance at $200 may slow further gains. A confirmed breakout above $197 could target $200-$202.50, while failure may lead to consolidation near $190.
Conclusion:
GOOGL is testing critical resistance near $197. A breakout could push the price toward $200-$202.50, while a rejection may pull it back to $190 or lower. Monitor volume and momentum closely for actionable trade setups.
Disclaimer:
This analysis is for educational purposes only and does not constitute financial advice. Always conduct your research and trade responsibly.

Upward parallel Channel Google is moving strangely but nevertheless currently moving up a parallel channel, using the anchored volume profile tool we have the VAL at 189.27 and the VAH at 196.55 and the POC at 193.47, we can consider those key levels, and a positive entry when we get price action above the short term trend line, the price is currently resting on the 200 EMA and the VAL and the bottom of the upward parallel channel, watch out for fake outs and for bearish break out of the parallel structure.

GOOGLE INC. (NASDAQ: GOOG) ANALYSIS AND TRADING PLANWelcome to a detailed analysis of Google Inc. (NASDAQ: GOOG). Using advanced analytical tools, including the proprietary TheWaved™ platform, this report dissects recent market behavior and provides actionable insights for traders and investors. Let’s explore the technical and fundamental dynamics of the stock and forecast future price movements with key support and resistance zones.
Overview of Current Market Position
Ticker: NASDAQ-GOOG
Current Price: $193.52
52-Week High: $202.88 (28 days ago)
52-Week Low: $83.45 (803 days ago)
Key Indicators:
RSI (14): 54.92 (neutral)
MFI (60): 41.67 (indicating low buying pressure)
Moving Averages (Daily):
MA50: $183.31
MA100: $173.39
MA200: $172.54
Technical Analysis
Support Levels:
187.16 | 185.08 | 181.41 | 176.09 | 173.53
Resistance Levels:
202.88 | 197.62 | 194.55
Moving Averages Insight:
The stock trades slightly below the MA50 and MA100 on the daily chart, indicating a potential bearish short-term outlook. However, the long-term trend remains intact as the price remains above MA200.
VSA Patterns:
Recent trading sessions highlighted critical Volume Spread Analysis (VSA) patterns:
Sell Volumes Max (2025-01-13 14:00 UTC): Increased sell volumes pushed prices down by 4.42%.
VSA Buy Pattern 3 (2025-01-13 10:00 UTC): Signals potential for a rebound after testing lower supports.
Trendline and Channel Analysis:
GOOG’s price action is constrained within an ascending channel since October 2024. The lower boundary aligns with the $188.00 support zone, while the upper resistance lies near $202.00.
Price Action Insight:
The recent lower highs and consistent rejection at $194.71 suggest a strong overhead supply zone. A break and close above $195.00 will be a decisive bullish trigger.
Key Oscillators:
RSI indicates no overbought/oversold condition, leaving room for directional moves.
Stochastic cross above 50 strengthens the probability of an upward trajectory.
Fundamental Analysis
Google continues to show robust performance driven by its advertising and cloud businesses. Recent developments include:
Q4 Earnings are expected to show a revenue growth of 11% YOY, boosted by robust ad demand and cloud service expansion.
Strong financial metrics: Cash reserves of $130 billion with minimal debt.
AI innovations: Google’s advancements in AI-based ad targeting offer a competitive edge over rivals.
Market sentiment: Increasing institutional accumulation as hedge funds position for long-term growth.
Forecast and Trading Plan
Short-Term Projection:
Price action indicates consolidation within $188.00-$195.00. Traders should monitor the $195.00 breakout level closely.
Medium-Term Projection:
Given the strength in fundamentals and supportive technicals, we anticipate an upward breakout, testing $202.88.
Long-Term Projection:
Once the stock decisively clears $202.88, a rally towards $215.00-$220.00 could unfold, aligning with the next Fibonacci extensions.
Trade Levels:
Entry: Buy at $188.00-$189.50 after confirmation of support.
Stop-Loss: Place at $185.00.
Take-Profit Targets:
Target 1: $195.00
Target 2: $202.88
Target 3: $215.00
Bearish Scenario:
A breakdown below $185.00 could accelerate selling pressure towards $176.00. In this scenario, adopt a defensive approach or short-term bearish bias.
Risk Management:
Maintain a risk-reward ratio of at least 1:3. Leverage smaller position sizes when trading near key support or resistance levels.
Conclusion
The technical and fundamental landscape for GOOG appears balanced, with bullish potential outweighing downside risks. Short-term traders can capitalize on the current consolidation phase, while long-term investors may find value in accumulating positions near support zones. Using TheWaved™’s advanced analytics, we’ll provide real-time updates as price action unfolds.
Concept of Rays
Explanation of the "Rays from the Beginning of Movement" Concept
Core Idea
My proprietary analysis method is based on using rays constructed on Fibonacci mathematical and geometric principles. These rays create a system of dynamic levels that help predict precise asset movements and identify key zones where price interactions occur. Price interaction with these rays signals probable scenarios: either a reversal or a continuation of movement, but only after interaction and the appearance of dynamic factors and patterns.
Why Predicting Specific Levels is Not Possible
Financial markets are nonlinear systems, where price movement is determined by numerous variables, including market volumes, liquidity, macroeconomic factors, and participant psychology. Instead of attempting to predict specific levels, I propose analyzing probabilities of price reaction at pre-calculated key zones. Price interaction with rays provides additional insights into the direction and strength of movement.
How Rays Work
Fibonacci Rays: Each ray corresponds to a specific angle of inclination, which is mathematically significant and correlates with natural proportions and the start of movement.
Primary Advantage: Rays are constructed from the beginning of a movement pattern, rather than traditional extremum points commonly used in classical technical analysis. This allows for the rapid and accurate accounting of new trend or corrective movement phases.
Adaptability: When a new pattern emerges, rays are automatically adjusted to show the potential movement range. Price may exit this range and enter another, interacting similarly with a different ray.
Rays are Ascending and Descending: They define the boundary of the movement channel.
If you have questions or need personalized analysis for other stocks, feel free to reach out in direct messages. All indicators and tools mentioned are available via our profile link.
Thank you for reading, and as always, trade safely and strategically!
Denis Mikheev - TheWaved™

Google Wave Analysis 13 January 2025
- Google reversed from pivotal support level 187.30
- Likely to rise to resistance level 200.00
Google recently reversed up from the pivotal support level 187.30, which is the lower border of the sideways price range inside which the price has been moving from last month.
The support level 187.30 was strengthened by the lower daily Bollinger Band and by the 38.2% Fibonacci correction of the sharp upward impulse from November.
Given the clear daily uptrend, Google can be expected to rise to the next round resistance level 200.00 (upper border of the active sideways price range).

Google (GOOGL) Technical Analysis and GEX for Options TradingTechnical Analysis Overview:
1. Market Structure:
* GOOGL is currently trading within a descending channel, indicating bearish pressure.
* Key levels include resistance at $196.50 and support at $187.50, with price moving closer to the lower support region.
2. Supply and Demand Zones:
* Demand Zone: $187.50 - $190.00 (highlighted by the significant GEX PUT support).
* Supply Zone: $196.50 - $200.00 (strong gamma resistance evident from GEX analysis).
3. Key Levels to Watch:
* Resistance Levels: $196.50, $200.00 (psychological and technical resistance).
* Support Levels: $191.00, $187.50 (key downside protection levels).
4. Volume and MACD Analysis:
* The MACD is showing bearish momentum, with the histogram trending downward.
* Recent volume spikes near $191 suggest heightened selling pressure, aligning with the bearish trend.
5. Trendline and EMA Analysis:
* Price is firmly below the 9 EMA and 21 EMA, confirming a bearish sentiment in the short term.
* A breakout above $196.50 would indicate a potential trend reversal; otherwise, the bearish channel will likely persist.
6. Stoch RSI:
* Currently oversold, suggesting a potential relief rally. However, confirmation from price action is essential before acting on it.
GEX Analysis for Options Trading:
1. Gamma Levels:
* Call Wall at $200.00: Strong resistance due to significant positive NETGEX.
* Put Wall at $187.50: Strong support reinforced by substantial negative NETGEX.
2. Options Flow and Sentiment:
* IVR: 62.2 indicates high implied volatility, favoring premium-selling strategies.
* Call/Put Ratio: Slight bearish bias, supported by the heavier concentration of PUT walls below the current price.
Actionable Trade Setups:
1. Bullish Setup:
* Entry: Above $196.50 with strong volume.
* Target: $200.00.
* Stop-Loss: Below $194.00.
2. Bearish Setup:
* Entry: Below $190.00 with confirmed selling pressure.
* Target: $187.50, $185.00.
* Stop-Loss: Above $192.00.
Options Strategy Recommendations:
1. Bullish Strategy:
* Buy Call Spread: $195/$200 expiring in 2 weeks.
* Rationale: Capture potential upside toward $200.
* Risk: Limited to the premium paid.
2. Bearish Strategy:
* Buy Put Spread: $190/$185 expiring in 2 weeks.
* Rationale: Capitalize on a potential move toward $185.
* Risk: Limited to the premium paid.
3. Neutral Strategy:
* Iron Condor: Sell $200 Call and $185 Put, buy further OTM legs for protection.
* Rationale: Profit from consolidation between $185 and $200.
* Risk: Defined by the width of the wings.
Thoughts on Market Direction:
* Current Market Sentiment:
* The broader market appears to be leaning bearish, with selling pressure evident across major tech stocks. GOOGL is no exception, maintaining its descent within the bearish channel.
* If the broader indices such as NASDAQ show a strong recovery, GOOGL might attempt a reversal above $196.50.
* Market Risk:
* With high implied volatility (IVR 62.2) and bearish options flow, the likelihood of GOOGL testing its lower support levels at $187.50 is higher.
* However, traders should remain cautious of any gap-up or gap-down price action during the pre-market session, as this could disrupt existing setups.
Important Reminder for Traders:
* Check Pre-Market Price Action:
* Price might gap up or down at the market open, which could impact key support/resistance levels. Reassess price action and confirm setups before entering trades.
* Questions? Contact Me Directly:
* If you have any questions or need further clarification, feel free to reach out for support.
Conclusion:
GOOGL remains bearish with strong resistance at $196.50 and support at $187.50. Traders should closely monitor pre-market movements and broader market sentiment to refine their entries and exits. Employ a disciplined approach with tight stop-losses to manage risk effectively.
Disclaimer: This analysis is for educational purposes only. Always perform your due diligence and manage your risks before trading.

GOOGL: Bullish Momentum with Caution🔥 Potential Price Targets:
🩸 Near-term Goal: $194.72 (1-2 months)
🩸 Long-term Goal: $200.00 (3-4 months)
🔥 LucanInvstor's Strategy:
🩸 Short: Below $193.17, targeting $188 and $180. The MACD remains positive, but shrinking histogram bars suggest weakening momentum. A breakdown below support could trigger further declines.
🩸 Long: Above $194.72, targeting $200 and $210. The price is above both the 9-day and 200-day EMAs, suggesting a continuation of the bullish trend, but caution is needed due to potential weakening momentum.
🔥 LucanInvstor's Commands:
🩸 Resistance: $194.72 — A key resistance level; a break above this could lead to further upside.
🩸 Support: $193.17 — A critical support level; a breakdown below this could trigger a pullback.
Alphabet remains in a bullish trend, with the MACD confirming positive momentum. A breakout above resistance could lead to further gains, while a breakdown below support may lead to a pullback.
👑 "Precision in strategy drives success."

Imagine Using These Top 3 Indicators To Trade BetterThe stock market is going to be on fire today
because of the jobs numbers that are coming
out in the economic report
Lets look at google NASDAQ:GOOGL
this stock is in the same boat as amazon, and
Nvidia
At this price, they have touched the bottom
you can see this by using the MACD
indicator
Now this strategy
called The Rocket Booster Strategy
is based on long-term
momentum now even though
its simple do not let it fool you
this is a very powerful strategy which is priceless
and I am teaching it to you for free..
its crazy that am even showing you this for free
But that's okay the fact that this is an awesome community
thanks to Tradingview and its platform
I feel like teaching this strategy
is my way of learning more
and giving back to this awesome community of
traders from around the world.
Remember the 3 indicators:
-50 EMA
-200 EMA
-MACD
If you want to learn more about how these indicators
working together check out the resources below
To learn more rocket boost this content
Thank you for reading.
Disclaimer: Trading is risky please learn risk management
and profit-taking strategies
also feel free to use a simulation trading tool
before you trade with real money.

GOOGL Technical Analysis and GEX Insights-Jan. 8
Technical Analysis (30-Minute Chart and 1-Hour Chart)
* Trend and Price Action:
* On the 30-minute chart, GOOGL is in a consolidation phase after a strong upward move, forming a flag-like pattern.
* On the 1-hour chart, the price has pulled back from its recent highs near $202.50 and is finding support near $194.87.
* Volume: Declining volume during the pullback indicates the selling pressure may be losing momentum, which aligns with the possibility of a continuation of the prior bullish trend.
* Indicators:
* MACD: Shows signs of a potential bearish crossover, reflecting decreasing momentum but not yet confirmed.
* Stochastic RSI: Near oversold levels, indicating a potential reversal or consolidation phase.
* Key Levels:
* Support Levels:
* $194.87: Immediate support; breaking below this level could lead to a retest of $190.00.
* $187.50: A significant support level, with GEX data indicating strong PUT activity.
* Resistance Levels:
* $202.50: Immediate resistance; aligns with prior highs and a CALL wall.
* $205.00-$210.00: Extended resistance cluster with notable CALL interest.
GEX Insights for GOOGL
* Gamma Exposure (GEX):
* Positive GEX Zones:
* $202.50: Key CALL wall, acting as a strong resistance zone for upside movement.
* $205.00: Significant CALL wall, with additional resistance near $210.00, signaling heightened seller interest at higher levels.
* Negative GEX Zones:
* $194.00-$192.00: Heavy PUT concentration, indicating a critical support cluster.
* Below $190.00: Negative gamma exposure increases, suggesting higher volatility.
* Options Metrics:
* IVR (Implied Volatility Rank): 59%, indicating moderately elevated options pricing.
* Options Flow:
* CALLs: Dominant near $202.50 and $205.00, reflecting potential resistance at these levels.
* PUTs: Concentrated below $195, with heavy protective positioning at $190 and $187.50.
Trade Scenarios:
Bullish Scenario:
* Entry: Above $195.50 with confirmation of buying momentum.
* Target: $202.50 (initial), $205.00 (extended).
* Stop-Loss: Below $194.00 to limit downside risk.
Bearish Scenario:
* Entry: Below $194.00 with strong selling volume.
* Target: $190.00 (initial), $187.50 (extended).
* Stop-Loss: Above $195.50 to cap losses.
Conclusion
GOOGL is consolidating near $195, with $202.50 acting as a critical resistance zone. A break above $202.50 could trigger further bullish momentum, while a breakdown below $194 could lead to increased selling pressure toward $190 or lower. GEX data confirms these levels as pivotal for directional movement.
Disclaimer: This analysis is for educational purposes only and does not constitute financial advice. Always conduct your own research and manage risk responsibly.
Let me know if you need additional insights or refinements!
