Google (GOOGL) Approaching a Make-or-Break Level!📊 Technical Analysis (TA):
1. Trend & Structure:
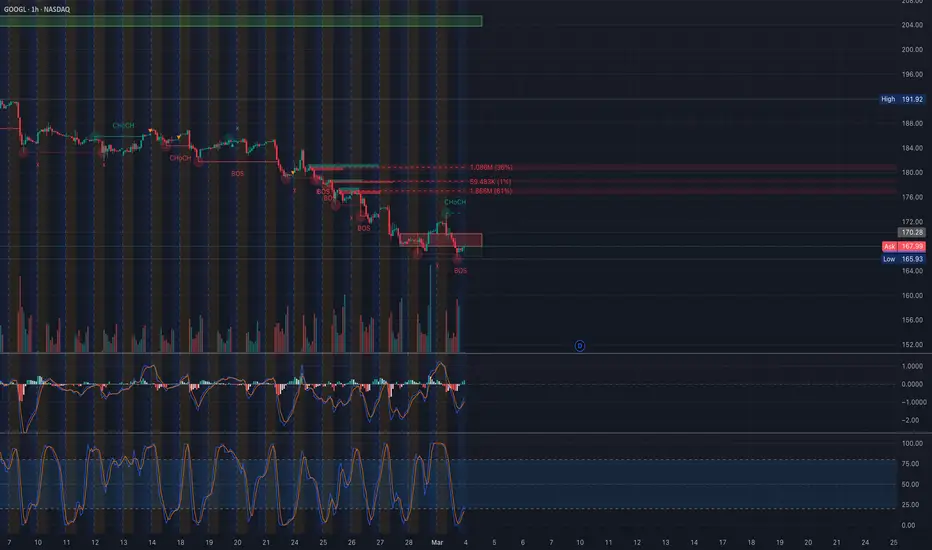
* GOOGL remains in a strong downtrend, confirmed by multiple Break of Structure (BOS) signals.
* A recent Change of Character (ChoCH) attempt suggests a possible reversal, but confirmation is needed.
* Key Resistance: ~177-180 (supply zone)
* Support Zone: ~165-167 (high liquidity demand area)
2. Indicators Suggesting a Possible Reversal:
* MACD: Momentum is starting to slow down, and a potential bullish crossover may be forming.
* Stochastic RSI: Oversold conditions suggest a possible short-term bounce.
* Volume Spike: Strong buying volume appearing near support levels indicates institutional interest.
🔹 GEX & Options Flow:
1. Call Walls (Resistance) 🚧
* 177-190: Major resistance levels, likely to reject price on any bounce.
* 200: 3rd Call Wall, where gamma resistance is strong.
2. Put Walls (Support) 🛑
* 160: Highest negative NETGEX, meaning a break below could accelerate a sharp drop.
* 155-150: Next downside targets if 160 fails.
3. IV Rank & Skew:
* IVR 50.5, indicating mid-range volatility.
* IV skew suggests a neutral to slightly bearish bias.
* Calls only 3.2%, confirming put dominance.
📌 Trading Plan & Suggestions:
* Bullish Reversal Scenario:
* If GOOGL holds 165-167, we could see a bounce toward 175-180.
* Ideal trade: March-April 170C or 175C, targeting a reversal.
* Bearish Breakdown Scenario:
* If GOOGL breaks 165, expect a drop toward 160, triggering put-heavy action.
* Ideal Put Play: Buy March-April 165P or 160P targeting 150-160.
⚠️ Key Warning: The next few candles will be critical—watch for bullish confirmation before going long.
🔥 Conclusion: GOOGL Near a Reversal Zone – Watch for Confirmation!
Google is testing a key support area, with indicators showing early signs of a bounce. However, if 165 fails, we could see a sharp drop toward 160-155. The next sessions will determine the trend—stay alert for reversals or breakdowns! 🚀📉
🚨 Disclaimer:
This analysis is for educational purposes only and does not constitute financial advice. Always do your own research and trade responsibly.
GOOGL trade ideas
Alphabet Inc. (GOOGL) – Bullish Reversal Opportunity📉 Google stock has corrected ~16.9% from its $207 high last month, now testing a strong trendline support.
With bullish RSI divergence and major AI investments ahead, this could be a prime buy-the-dip opportunity!
📊 Trade Setup:
🔹 Entry Price: $171.80 (Current Price)
✅ Take Profit 1: $190 (Short-term resistance)
✅ Take Profit 2: $207 (Previous high)
✅ Take Profit 3: $220+ (Analyst average price target)
🔹 Stop-Loss: $165 (Below trendline)
🔹 RSI: Bullish divergence – signaling potential upside momentum
📈 Why Google?
AI & Cloud Expansion – $59B AI revenue expected by 2028 (Morgan Stanley)
Waymo Growth – Autonomous vehicle expansion into Miami (2026)
YouTube & Digital Ads – Performance Max driving revenue gains
Strong Cloud Business – Competing with AWS & Microsoft Azure
🔹 Analyst Insights:
Average Price Target: $210.62, implying a 23.66% upside from the current price.
High Price Target: $250.00, suggesting significant growth potential.
Consensus Rating: Moderate Buy based on evaluations from 43 analysts.
🔹 Regulatory Caution: DOJ lawsuits are a concern, but long-term AI & cloud growth remain strong.
📌 Key Levels to Watch:
Holding support at $165? This could trigger a major upside move.
Break above $190? Momentum could accelerate toward $207+
📢 Google is not just a search company—it’s an AI, cloud, and automation powerhouse. With strong support, favorable analyst forecasts, & major catalysts ahead, this could be a prime accumulation zone! 🚀


Search for GainsAlphabet Inc. has been exhibiting bullish momentum, with a notable gap forming around the $170 level, indicating renewed investor interest. This technical setup suggests the potential for a significant upward move, with the stock eyeing the $175 resistance level as a pivotal point. A successful breakout above this threshold could propel GOOGL toward the $191.79 resistance, offering an attractive risk-to-reward ratio for investors.
Why GOOGL Could Accelerate to $191.79:
Analyst Insights: Analysts have identified GOOGL as a potential rebound candidate for 2025, noting its inclusion among stocks that could recover after previous declines.
Technical Indicators: GOOGL's current price of $170.28 is approaching the 50-day moving average of $190.58, and a sustained move above this average could signal a bullish trend continuation.
tipranks.com
Financial Performance: In the third quarter of 2024, Alphabet reported revenues nearing $3.5 billion, with a net income of $238 million and an Adjusted EBITDA of $503 million, reflecting robust operational performance.
Strategic Initiatives: The company's recent pricing of $700 million in senior notes due 2030 indicates a strategic approach to strengthening its capital structure, potentially supporting future growth initiatives.
Key Levels to Monitor:
Support: $170 (gap level), $163.72 (stop-loss)
Breakout Trigger: $175 (weekly resistance)
Target: $191.79 (major resistance)
investopedia.com
If GOOGL maintains its bullish momentum and decisively breaks through the $175 resistance with substantial volume, it could be on track for a significant rally toward $191.79. However, investors should remain vigilant, as market conditions can change rapidly. Implementing a stop-loss at $163.72 is advisable to manage potential downside risks.
Disclaimer: This analysis is for informational purposes only and does not constitute financial advice. Investors should conduct their own research and consult with a financial advisor before making investment decisions.
NASDAQ:GOOGL

Google is going to its Google thing. Bullish 4hHistorical severely oversold area.
Welcome to the MAX PAIN (looking at the greed&Fear at 11 today)
At this max fear stage it’s hard for the herd to see wood for the trees and things also the perfect phase to pickup a contrarian play.
👇
🔹 **Trade Direction:** Long (Potential Reversal)
🔹 **Entry:** $170 - $173 (Current Zone)
🔹 **Stop Loss:** $165 (below recent support)
🔹 **Target 1:** $182 (key resistance level)
🔹 **Target 2:** $192.50 (prior swing high)
📊 **Probability & Justification:**
- **Momentum Shift:** Oversold conditions with multiple strong buy signals across timeframes.
- **Indicators:** Stochastic RSI deeply oversold, with RSI on daily at 27.16—historically near bounce zones.
- **Moving Averages:** Price trading below key moving averages but stabilizing.
- **Volume Profile:** Signs of potential accumulation; need confirmation.
⚠️ **Risk Considerations:**
- A breakdown below $165 invalidates the setup.
- Bearish sentiment still dominant; a confirmed higher low is needed.
- Strong resistance ahead at $182; partial profit-taking recommended.
📉 **Bias:** Cautiously bullish—confirmation required for trend shift.

Google - Buy Cycle Google
Buy cycle
Tp@206.75
% bubble
Price launched from the base at 206.75.
Potential Down Trend shown in the chart.
Treading plan:
We need to wait to see the price interaction with the trend line which will be a guide for deciding on the entries for the long position.
Spot orders:
Entry 1: 144
Entry 2: 124
Entry 3: 103
TP: 206

Bearish on short termI would consider the trend line a safe place to get in. Also the intersection with the strong support at 145 is a very bullish point, IF it gets there. Otherwise, just want for GOOG to reach the trend line.
Worst case scenario, if the bear market does take place, today's position will recover in about 1.5 years.


Google Likely On SupportGOOGL is likely finding support on $174. It's following the panic trend right now as almost everything Computer/Tech has been sold deep into support bids. GOOGL finding support here along with AMZN at $214 leads to my theory IXIC is ready to break resistance.
If it fails to hold $174, then the major support at $148 should lift it back up towards it's final target (or next major support) of $252.
Good luck!

Does the Corrective Bearish Rally Continue?GOOGL remains in a corrective downtrend, presenting potential opportunities for strategic entries. If the pullback deepens, we could capitalize on key support levels:
📉 Entry Points:
🔹 173
🔹 162
🔹 152
📈 Profit Targets:
🔹 181
🔹 189
🔹 206+
Will the price rebound from these levels, or will the downtrend extend further? Stay sharp and manage your risk accordingly.
Disclaimer: The information provided is for educational purposes only and does not constitute investment advice. Trading involves significant risks, and past performance is not indicative of future results. Always conduct your own analysis and consult a financial advisor before making any investment decisions.


GOOGLE Long PlanSo here is our plan for entering a Google long position. And you know what the old saying is "plan your trade, and trade your plan".
We will be looking long and hard at the volume profile when we reach that area.
Our last Google trade that we posted it all the Take Profit points, and was great.
So mark this on your chart and set alerts.

GOOG Analysis: Short Opportunity on the Horizon?Hello Traders,
I'm sharing my analysis for GOOG, breaking it down in the simplest way possible.
Wave Patterns:
The previous upward trend lasted 3x as long as the recent downtrend, which was 2x. By dividing the last uptrend into three equal periods (3x), I projected the future downtrend (2x) to mirror the previous wave structure (5x total: 3x uptrend and 2x downtrend). Based on this, I expect the downtrend that began on July 8, 2024, to potentially conclude around August 25, 2025.
Regression Channel:
I've drawn the main regression channel on the weekly chart. GOOG's price recently bounced from the channel's upper deviation line, dropping from 190 to 155, which is near the channel's middle line. I anticipate it could reach 175 before continuing downward, forming a new downtrend.
Conclusion:
Given these observations, I see a promising short opportunity, targeting the channel's lower deviation at 127.
Let's keep a close watch on this setup!
NASDAQ:GOOG

GOOGL Technical Analysis & GEX Options Setup for February 26📌 Key Observations from the Charts
1. Market Structure & Price Action:
* GOOGL had a sharp breakdown from the 185-187 resistance zone, dropping toward 179.
* Support Levels:
* 179.08 (current low)
* 175.00 (next major support & Put Wall zone)
* Resistance Levels:
* 182.74 (first resistance).
* 185.45 (Value Area High & previous breakdown level).
* If 179 fails, expect acceleration to 175.
2. Volume Profile & Auction Levels:
* Point of Control (POC): 179.43 → High liquidity area, acting as short-term support.
* Value Area High (VAH): 185.45 → First key resistance zone.
* Value Area Low (VAL): 179.08 → Key level to hold for buyers.
3. Indicators Review:
* MACD: Bearish, showing momentum to the downside.
* Stochastic RSI: Oversold but not yet rebounding—selling pressure still strong.
🛠️ Options GEX Analysis
* Call Resistance:
* 190-200 → High gamma resistance, strong call walls preventing upside.
* Put Walls & Support Zones:
* 175 → Highest Put Wall & Negative NETGEX (strong support).
* If price loses 179, it may quickly drop to 175 due to gamma exposure.
* Implied Volatility (IVR & IVx):
* IVR 29.7 | IVx Avg 29.9 → Neutral IV environment.
* Call Positioning 13.7% → Some bullish bets, but still weaker than put positioning.
📈 Trade Setups & Game Plan
🔴 Bearish Scenario (Preferred Setup)
🔹 Entry: Short below 179 confirmation.
🔹 Target 1: 175 (Put Support).
🔹 Target 2: 172-170 (extension move).
🔹 Stop-Loss: Above 182.74 (invalidates breakdown).
🔹 Options Strategy:
* Buy PUTS 180/175 expiring 1-2 weeks out if breakdown confirms.
* Debit Put Spread (Bearish 180P/170P for risk control).
🟢 Bullish Scenario (Less Likely)
🔹 Entry: If price reclaims 182.74, targeting 185+.
🔹 Target 1: 185.45 (first resistance).
🔹 Target 2: 190 (Gamma Wall).
🔹 Stop-Loss: Below 180 invalidates upside move.
🔹 Options Strategy:
* Sell 175/170 Put Credit Spread for a bounce play.
🎯 My Thoughts & Suggestions
* Main Bias: Bearish, unless 182.74+ is reclaimed.
* Gamma Risks: Below 179, strong gamma exposure can push GOOGL lower quickly.
* Options Play: Puts look stronger based on GEX positioning & technical weakness.
⚠️ Disclaimer
This analysis is for educational purposes only and does not constitute financial advice. All trading involves risk, and past performance is not indicative of future results. Please do your own research and consult a professional financial advisor before making any investment decisions.

GOOGL TO 176-170 NASDAQ:GOOGL
Swing High to Swing Low. Google has now dropped out of the consolidation range and looks to be going towards the gap fill. 176 is the next key support with 181 being a key resistance. If Google can't reclaim and hold above 181 then I wouldn't be shocked to see a relief bounce up towards 180 and back down. The bounce is to add another touch on the downward trend line.
I am bearish on Google unless it can hold above 181 or after the gap below is filled then I can see Google at 176-170 making a turn back up depending on market structure. I like Google long back to 200 as I have started my 1/20/26 200c position but short term Google to 176-170


Google Wave Analysis – 21 February 2025
- Google under bearish pressure
- Likely to fall to support level 175.00
Google is under bearish pressure after the earlier breakout of the support zone between the key support level 182.20 (former monthly high from November), the support trendline of the daily up channel from September and the 38.2% Fibonacci correction of the upward impulse from September.
The breakout of this support zone accelerated the active corrective wave 4 of the intermediate impulse wave (C) from September.
Google can be expected to fall to the next support level 175.00 (lower border of the upward gap from December).


Google - This Can Be A Major Opportunity!Google ( NASDAQ:GOOGL ) is rejecting the resistance:
Click chart above to see the detailed analysis👆🏻
Over the past couple of years, Google has actually always been rejecting the upper channel resistance trendline with the only exception being the 2021 breakout. Following this previous behaviour, another bearish rejection is probable although bulls remain overall in control.
Levels to watch: $200, $150
Keep your long term vision,
Philip (BasicTrading)

GOOGL Approaching Key Resistance! Trade Setups for Feb. 20Technical Analysis (TA) Overview
GOOGL is trading near 185, recovering from a recent pullback. The stock is consolidating and approaching resistance at 187.50, which aligns with a key call wall level.
📌 Key Support & Resistance Levels:
* Resistance: 187.50 (GEX Call Wall), 190 (major breakout level)
* Support: 183.77, 181.80 (key demand zone), 180 (major put support)
📌 Indicators:
* MACD: Slightly bullish but momentum is weak, indicating indecision.
* Stoch RSI: Overbought (89.73), signaling potential for a short-term pullback.
* Volume Profile: High trading activity around 185-186, meaning price may stall at this level.
Gamma Exposure (GEX) & Options Sentiment
🔹 Call Walls (Resistance):
* 187.50: Strong call resistance, meaning upside could stall here.
* 190: Highest call resistance—unlikely to break without a strong catalyst.
🔹 Put Walls (Support):
* 180: Heavy put positioning—likely strong support on any dip.
* 175-177.50: Deeper put levels, meaning a break below 180 could accelerate downside.
🔹 Options Sentiment:
* IVR: 18.4 (low volatility—potential for a breakout if volume spikes).
* Call Open Interest: 14.4% – Bearish bias in options positioning.
Trade Scenarios for Tomorrow
✅ Bullish Setup:
* If GOOGL breaks 186-187.50, expect a push toward 190.
* Ideal entry: Above 186, stop-loss below 185.
* Profit targets: 187.50, 190.
❌ Bearish Setup:
* If GOOGL fails at 187 and breaks below 185, expect a move toward 183-180.
* Ideal entry: Below 185, stop-loss above 187.50.
* Profit targets: 183, 181.80, 180.
Probability Estimate for GOOGL’s Next Move: Bullish Move Above 187.50 (Targets 190)
Scenario Probability (%): 45%
Reasoning: GOOGL is approaching a strong call wall at 187.50.
• Momentum is weak, so a breakout is possible but needs high volume. | | Choppy/Sideways (Range 183-187.50) | 35% | - Volume profile shows major activity around 185, meaning price could consolidate.
* Low IVR suggests a lack of strong movement unless a catalyst appears. | | Bearish Breakdown Below 185 (Targets 183-180) | 20% | - Stoch RSI is overbought, indicating some downside risk.
* If selling pressure increases, 183-180 becomes the next demand zone. |
Final Thoughts
* GOOGL needs to break 187.50 for upside toward 190.
* Failure at 187.50 likely leads to sideways movement or a rejection back to 183-180.
* Low IVR means options are cheap, but also suggests lower volatility.
🔹 Best Trading Plan:
* Bullish Play: Look for a breakout above 186-187.50 → target 190.
* Bearish Play: Watch for rejection at 187.50 or break below 185 → target 183-180.
🚨 Disclaimer: This analysis is for educational purposes only and does not constitute financial advice. Always conduct your own research and trade with proper risk management.

GOOGL OUTLOOKFor GOOGL, key levels are identified to evaluate market entries and exits. One strategy could be to look for buying opportunities when the price approaches or falls within the 175 to 180 range, capitalizing on potential bounces or technical support. Conversely, taking profits or closing positions might be considered in the sell zone around 188 and 192, where resistance levels could occur. It is crucial to complement these strategies with additional technical analysis and to remain aware of market volatility.
Disclaimer: The information provided is for educational purposes only and does not constitute investment advice. Trading involves significant risks, and you should consult a financial advisor before making any decisions

GOOG setting up for a swing to the upside?GOOG remains in an uptrend, with its price potentially bouncing from the uptrend line started in September. This week I've got this on my list for a trade to the upside. Early entry would be a rise above $188 (a reclaim of the 4h 10EMA), though I am likely to wait for the reclaim of the 20EMA. I want to see high volume here and the market either flat or rising. Would be a no brainer if the NASDAQ and SPX break through their ATH. That momentum would be phenomenal for this play. I'd also consider here a stock buy for a longer play.
For the sake of objectivity, here are other things to note:
Key levels:
$183.53: This level aligns with the September uptrend line and will be an area to watch. A break below this could lead to a test of the 200SMA.
$192.09: The daily 50SMA and a prior consolidation zone coincide with this level. Reclaiming this area would strengthen the bullish case, suggesting the pullback may have concluded.
$202.51: A key resistance level and the site of the recent highs. A breakout above this could reinforce a bullish sentiment.
For a shorter term swing, I'd bring in the 4h chart and watch for a reclaim of its 20EMA, with high volume. This area will be close to the daily's 20EMA. I'd want to watch for confirmation of a move up by the price holding above the $192 level. For a longer term hold, I'd want the price to clear the weekly 10EMA, otherwise I'd count on the price retracing to the weekly's 50SMA.
Alternative scenarios:
Bearish: A decisive break below $183.53 would likely lead to a test of the daily 200SMA or weekly 50SMA. You can see that GOOG retraces to the weekly 50SMA quite often.
Neutral: Consolidation between $183 and $202 would indicate indecision and continued base-building.

GOOGL Stock Analysis & GEX Options Insights – Feb. 18Technical Analysis (TA) for GOOGL
* Current Price Action: GOOGL is attempting a recovery from a previous downtrend, but price is consolidating around the $185 level. Momentum is neutral, suggesting indecision in the market.
* Support & Resistance Levels:
* Immediate Resistance: $188 – A breakout above this level could fuel a move higher.
* Next Resistance: $195 – This aligns with the 2nd Call Wall from GEX data.
* Major Resistance: $200 – Strong resistance based on options positioning.
* First Support: $181 – This is a critical level to hold, as a breakdown could trigger a move lower.
* Major Support: $175 – Below this, GOOGL may accelerate downward.
* Indicators:
* MACD: Near the zero line, indicating a lack of strong momentum in either direction.
* Stochastic RSI: Oversold but starting to curl up, suggesting a possible bounce.
Options Flow & GEX Analysis
* GEX (Gamma Exposure):
* Highest Positive NetGEX / Call Resistance: $200 – This is the key resistance where a reversal could occur.
* 51.02% Call Wall: $195 – A critical level that could act as a resistance zone.
* Put Wall Support: $180 – The market might find support here, as 69.89% of puts are concentrated at this level.
* 3rd Put Wall: $175 – If GOOGL breaks down further, this could be the next major support area.
* IV & Sentiment:
* IV Rank (IVR): 20.3 → Low implied volatility, meaning options are relatively cheap.
* IVx Avg: 33.5 → A moderate volatility level.
* Options Sentiment: Calls = 12.8% → Higher than usual, indicating a possible bullish tilt in options flow.
Trade Setups
📈 Bullish Scenario (Breakout Play):
* Entry: Above $188 with strong volume.
* Target: $195, then $200.
* Stop Loss: Below $185.
📉 Bearish Scenario (Breakdown Play):
* Entry: Below $181.
* Target: $175 (Put Support).
* Stop Loss: Above $185.
Final Thoughts
* GOOGL is at a critical inflection point, hovering around key support at $185.
* A move above $188 could lead to a rally towards $195-$200, driven by options flow.
* A break below $181 could see downside acceleration toward $175.
* Best Trade Approach: Wait for a breakout confirmation above $188 or breakdown confirmation below $181 before entering a trade.
🚨 This analysis is for educational purposes only. Trade responsibly and manage risk! 🚨
