GOOGLE Rockets! 15-Min Surge Hits All Targets – What's Fueling?ALPHABET (GOOGLE) Analysis:
Alphabet Inc. (GOOGL) experienced a powerful upward movement in the 15-minute timeframe, achieving all set profit targets with ease using the Risological Swing Trader.
The momentum from a strong earnings report has aligned with a positive risk sentiment across US equity indexes, sparking increased buying interest in tech giants like Alphabet.
Here’s a breakdown of the trade and supporting market context:
Entry : $164.75
Targets Achieved:
TP1: $167.07
TP2: $170.81
TP3: $174.56
TP4: $176.88
Stop Loss (SL): $162.87
Market Sentiment:
Recent quarterly earnings reports have fortified investor confidence, with broader equity indexes advancing. Alphabet's strong fundamentals and growth projections contributed to the bullish sentiment, encouraging traders to follow through on this aggressive buying trend.
With all targets hit in a single session, this upward momentum for Alphabet highlights robust institutional interest and solid fundamentals. Keep an eye on further tech earnings, which may continue to impact Alphabet's trajectory in the upcoming sessions.
GOOGL trade ideas

A BIG WIN for GOOGLE Congrats 2 those who followed this analysis
A BIG WIN for GOOGLE and For You !
I knew that the "Stacked Channel" was the key and that Google would make a decision sooner or later. If we look closely, the price tried to rise several times. However, the key this channel gave us was from October 7th, with that bearish volume candle. Although it was coming down strongly, it didn’t manage to break my stacked channel. This is a very clear signal from the price, telling us: I'm still strong and still in the bullish game.
one more detail to conclude is that the price is signaling with wicks that there’s a lot of buying pressure, and it’s not yet for a bear market.
Google's only hope was the earnings report, and with an excellent report and very solid numbers, we won big on this analysis!
Congratulations if you followed this analysis and entered before the report. As I had mentioned several weeks ago, I’ve always been "Bullish" on Google, and it didn’t disappoint me, either technically or fundamentally. Google remains STRONG !
Thank you for supporting my channel & Congrats to you!
Best regards

Be careful with Google !!!Alphabet's (NASDAQ:GOOGL) third-quarter results exceeded analysts' estimates with increased ad revenue. Alphabet reported its third-quarter results on Tuesday, showing that the search giant's advertising revenue surpassed Wall Street estimates, alleviating concerns about competitive threats from AI search products. Alphabet Class A shares (NASDAQ:GOOGL) rose more than 6% in after-hours trading following the report. The company reported earnings of $2.12 per share on revenue of $88.27 billion, compared to expectations of $1.84 per share on revenue of $86.37 billion.
Advertising revenue in the third quarter increased from $59.65 billion in the same period last year to $65.85 billion, and YouTube advertising revenue increased from $8.95 billion to $8.92 billion. Google Cloud revenue increased from $8.41 billion in the same period last year to $11.35 billion.
✨We spend hours finding potential opportunities and writing useful ideas, we would be happy if you support us.
Best regards CobraVanguard .💚
_ _ _ _ __ _ _ _ _ _ _ _ _ _ _ _ _ _ _ _ _ _ _ _ _ _ _ _ _ _ _ _
✅Thank you, and for more ideas, hit ❤️Like❤️ and 🌟Follow🌟!
⚠️Things can change...
The markets are always changing and even with all these signals, the market changes tend to be strong and fast!!

GOOGan upward trend in the prices of an industry's stocks or the overall rise in broad market indices, characterized by high investor confidence

Run is overGoog has become one of the many bloated pig stocks whos cycle is ending. Just like Ford or IBM, every dog has its day and the charts are showing the future. A retest of the 2023 low will have to hold or we are going all the way back to 2018 lows.

Alphabet Inc. (GOOGL) Shares Rise to $180Alphabet Inc. (GOOGL) Shares Rise to $180 Following Earnings Report
On September 10, we noted that GOOGL shares:
→ Were forming an ascending channel (highlighted in blue on the chart below, updated with the latest trading data);
→ Could begin to rebound from the psychological support level of $150 (indicated by an arrow).
Since then, the price did indeed turn upward from that level, fluctuating in October between a support level of $160 and a resistance level of $168, signaling a supply-demand equilibrium.
However, this balance now appears to be shifting, as Alphabet Inc. (GOOGL) released its Q3 earnings report post-market yesterday, surpassing expectations:
→ Earnings per share: actual = $2.12, expected = $1.84
→ Gross revenue: actual = $88.27 billion, expected = $86.39 billion.
Investors were likely encouraged by the company’s statement that its AI investments are "paying off." Consequently, Alphabet's shares rose to $180 in after-hours trading, suggesting a likely opening at this level in today's main session.
Today’s technical analysis for GOOGL suggests that trading will likely open with a bullish gap, as:
→ The price breaks above its range, crossing the $168 resistance;
→ It reaches the median of the long-term ascending channel, where a new buyer-seller consensus may form.
If this bullish sentiment persists, GOOGL's price may continue climbing toward its historical high near $190 this year.
According to a TipRanks survey:
→ 22 out of 28 analysts recommend buying GOOGL shares.
→ The average 12-month price target for GOOGL is $201.54.
This article represents the opinion of the Companies operating under the FXOpen brand only. It is not to be construed as an offer, solicitation, or recommendation with respect to products and services provided by the Companies operating under the FXOpen brand, nor is it to be considered financial advice.

You should google it! $NASDAQ:GOOG NASDAQ:GOOG
Investors sometimes overlook that Google is one of the original FAANG stocks, underscoring its significant influence in tech and resilience over time.
Earnings Highlights:
• EPS: $2.12 vs. $1.84 expected
• Revenue: $88.27B vs. $86.31B expected
Ever wonder if a company holds a monopoly? Look no further than when its products become synonymous with everyday language, and it has the financial power to acquire nearly any competitor in its path.

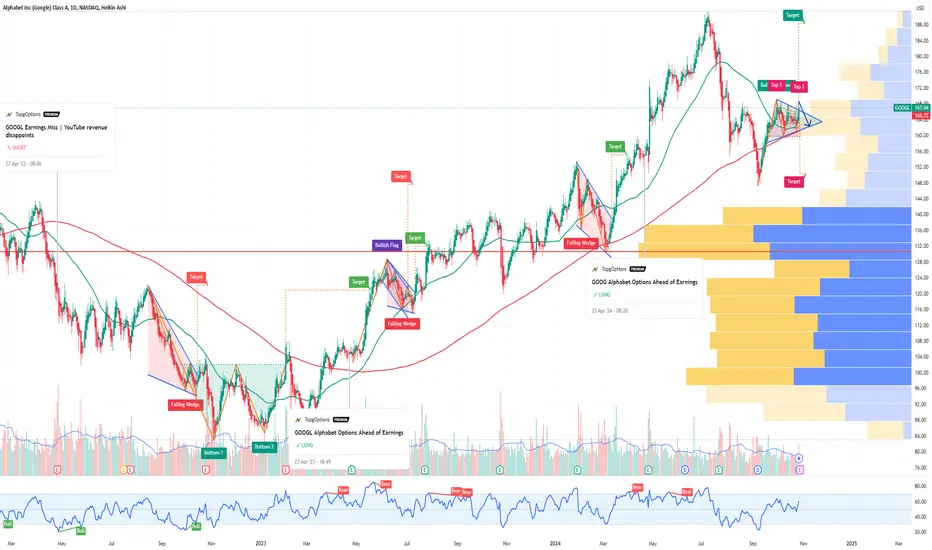
Bullish End of Year?This chart shows the price development of Alphabet (Google). Since reaching its high in July, the stock has been in a downward correction. However, it now appears that this correction may be ending. The price has formed a higher low, which could serve as the right shoulder in an inverse Head & Shoulders pattern.
Additionally, the SMAs are bullishly aligned once again. If the price breaks above the 38.2% Fibonacci level, I anticipate a bullish move toward the end of the year.

Alphabet (Google) Cup and Handle Bullish Technical FormationIn the domain of technical analysis of market prices, a cup and handle or cup with handle formation is a chart pattern consisting of a drop in the price and a rise back up to the original value, followed first by a smaller drop and then a rise past the previous peak. It is interpreted as an indication of bullish sentiment in the market and possible further price increases.
The cup part of the pattern should be fairly shallow, with a rounded or flat "bottom" (not a V-shaped one), and ideally reach to the same price at the upper end of both sides. The drop of the handle part should retrace about 30% to 50% of the rise at the end of the cup. For stock prices, the pattern may span from a few weeks to a few years; but commonly the cup lasts several months, while the handle should last for a shorter time.
A cup and handle formation is considered significant when it follows an increasing price trend, ideally one that is only a few months old. The older the increase trend, the less likely it is that the cup and handle will be an accurate indicator. The trade volume should decrease along with the price during the cup and should increase rapidly near the end of the handle when the price begins to rise.
The main technical graph for Alphabet Inc (Google) stock indicates on Cup and Handle Bullish Technical formation, since the price rose heavily over 2-years period of time (mid-2022 to mid-2024), and then 0.382x Fib retraced so far from its historical peaks.
This one can be entitled for so-called "cup and handle" respectively, with a further upside potential.

Google update Google.update I was also aware.of the pick before touching 160 n 154 again the analysis itself was showing support aswell n ready to go,what is good about my analysis? it shows clear trend n right time to enter n simple to follow aswell am looking forward to hit 180 as a first tp n wish everyone who took advantage of it more blessings to you n your family.

Google update Google.update I was also aware.of the pick before touching 160 n 154 again the analysis itself was showing support aswell n ready to go,what is good about my analysis? it shows clear trend n right time to enter n simple to follow aswell am looking forward to hit 180 as a first tp n wish everyone who took advantage of it more blessings to you n your family.

GOOG Technical Analysis on October 29, 2024:Key Levels
Resistance:
170.75 - 170.72: Major resistance range where GOOG has faced selling pressure.
169.23 - 169.16: Short-term resistance zone. If the price breaks above this, it may test the higher resistance levels.
Support:
167.61: First layer of support, which could provide a bounce opportunity.
165.76: Stronger support level; a break below this could indicate further downside risk.
162.78: Major swing support; likely to attract buyers if reached.
Entry/Exit Points
Scalping:
Entry: Consider entering near 167.61 if GOOG shows buying interest. A break above 169.16 could provide a quick scalp towards 170.72.
Exit: Exit scalps before key resistance zones, like 169.23 and 170.72, or on signs of rejection at these levels.
Swing Trading:
Entry: Watch for a retracement to 165.76 for a possible entry, especially if price shows consolidation around this level.
Exit: Consider exits near the 170.72 resistance zone or higher if momentum supports a continued rally.
Directional Suggestion
Bullish Bias if GOOG can maintain above 167.61 and break through 169.23; this could lead to a test of 170.75.
Bearish Bias if GOOG fails to hold above 165.76, with the next support level being 162.78.
Disclaimer: This analysis is for informational purposes only and should not be considered financial advice. Always conduct your own research and consider consulting a financial advisor before trading.

GOOGLE SHORT TRADE OUTLOOK ON EARNINGS REPORT DAY OCT.29, 2024NASDAQ:GOOGL
WEEKLY FUNDAMENTAL ANALYSIS:
>P/E Ratio (Quarterly Lookback): Google's P/E is currently at around 25, signaling overvaluation (typically anything equal or above 25 is considered overvalued).
>Correlation: Both Google's P/E ratio and value compared to Treasury bonds are flashing overvalued signals.
DAILY OUTLOOK:
>Short-term and long-term value correlations vs T-bonds and P/E ratios suggest the stock may remain overbought until the upcoming earnings report, which could act as a catalyst.
>Election Year Seasonality is strongly bearish as well.
TECHNICAL INSIGHT:
>GOOG may pull back to fill a previous price gaps before slowing down.
Stay sharp, traders! 🎯 #GOOG #ShortTrade #MarketAnalysis #Investing
Disclaimer: This post is for informational and educational purposes only and should not be considered financial advice. It reflects general market fundamentals and personal speculation. Always do your own research and consult with a professional before making any financial decisions. Trade at your own risk.

GOOGL Alphabet Options Ahead of EarningsIf you haven`t bought the dip on GOOGL:
Now analyzing the options chain and the chart patterns of GOOGL Alphabet prior to the earnings report this week,
I would consider purchasing the 165usd strike price Puts with
an expiration date of 2024-11-1,
for a premium of approximately $4.80.
If these options prove to be profitable prior to the earnings release, I would sell at least half of them.
If You Can Buy Google Stock You Can Learn This #1 StepThe #1 step am talking about here is going to really shock you.
It actually the last step in the rocket boost strategy.
Especially when it comes to google NASDAQ:GOOGL
Now may be thinking,
“The last step should not be a gap instead it should be
the crossover of te moving averages”
Now am not going to say thats wrong.Because the last step
is really about market psychology.
On order for you to really understand market psychology
you are going to have to invest in some form of education
in yourself to understand this last step.
Ideally, you should be inside a financial newsletter so that
you give you mind some time to understand this process
because its a philosophy that you will need time
To believe in.The best shortcut is to learn how to campaign
If you want to not make money in the financial market
then you dont relly need to invest in your education, and that's
okay but if you want to really understand the rocket booster strategy than
you have to invest in your education about the stock market.
Rocket boost this content to learn more.
Disclaimer:Trading is risky you will loe money
wether you like it or not please learn risk mangement
and profit taking strategies.

Too Busy? Then Buy Google Stock To Understand This 3 Step Systemits been a boring weekend for me and this is why.
You see like most traders starting in the
trading industry i was used to sitting on my
chair and watching the price movements this was
a justification for “working” in the stock market.
Look at this chart again: NASDAQ:GOOGL
Now you may be thinking,
“You have to watch all the price movements to
know where you stand.”
This is not a true statement instead what you need
is a trading strategy called ”The Rocket Booster Strategy”
This strategy has 3 steps:
• The price has to be above the 50 MA
• The price has to be above the 200 MA
• The price has to gap up in a trend
Now if you want you can ignore this strategy and develop
your strategies. But if you want to understand trend analysis
then you need to read the next article titled: If You Can Buy
Google Stock, You Can Learn This #1 Step
Disclaimer: Trading is risky you will lose money
whether you like it or not please learn risk management
and profit-taking strategies.

#1 Way To Know If Google Will Gap UpGoogle is a technology company under the NASDAQ
Stock Exchange,
Because of the coming economic jobs report data that will
be released this week its going to be an interesting
week in the stock market.
You may be thinking,
“The market is at all-time high..it will probably crash”
Well am really not sure about prediction market crashes
but something is going to happen
to google NASDAQ:GOOGL this
and so be sure to be ready.
Now if you dont want to trade the stock then
That's okay you can stand on the sidelines
But if you want to trade the market with the
professionals then you can not afford to miss
this opportunity is coming this week.
In order to learn more read the next article titled: Too Busy ?
Then Buy Google Stock To Understand This 3 Step System
Disclaimer: Trading is risky you will lose money
whether you like it or not please learn risk management
and profit-taking strategies.

How Google Stock Made Me Shocked In 2 DaysGoogle NASDAQ:GOOGL is one of those stocks that
will really shock you
and here is why,,
You may be thinking
“ Have you not talked about Google too much?”
The answer is no. Because you really have to understand
that this week is probably going to
be one of the most epic weeks of the financial
markets
Why?
Because both the SP500 and DOW have fallen meanwhile
NASDAQ has had a steady performance so far
if you want to ignore this week then i will understand
but if you want to understand
how to really trade the stock market
then watch out for this week
read the next article titled: #1 Way To Know If Google Will Gap Up
Disclaimer: Trading is risky you will lose money
whether you like it or not please learn risk management
and profit-taking strategies.

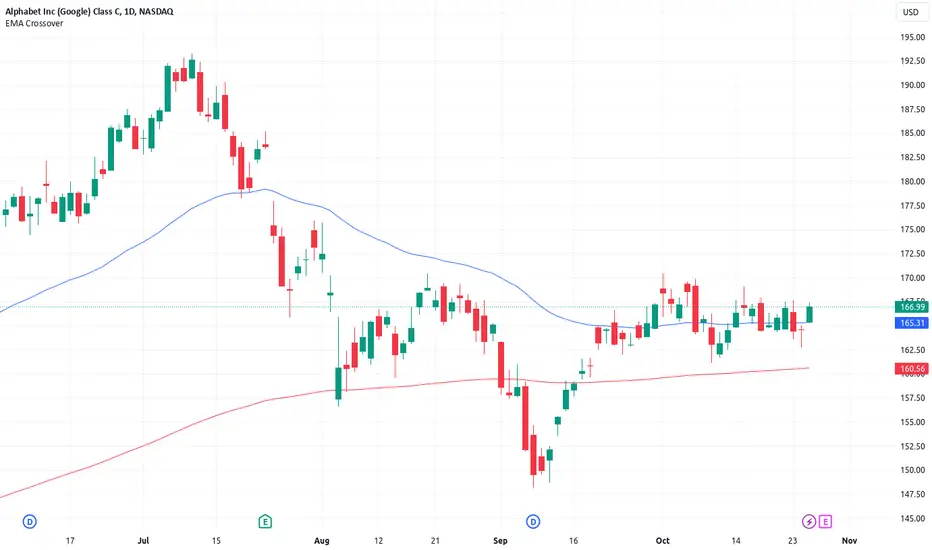
Daily chart of the 7 MagnificentsHello,
Daily chart of the Magnificent 7 chart.
Are we heading towards a double top?
The 200-period simple moving average in orange is bullish.
On the chart, the 3 accumulation zones are indicated.
Elections are coming soon, things can change.
Make your own opinion before placing an order.
► Thank you for boosting, commenting, subscribing!

$GOOGNASDAQ:GOOG is setting up for the earnings (on Tuesday). Lots of patterns align here. Flag + inverse head and shoulders. Look for push above 167$. Just be careful becoz GOOG has rejected 100times under the 170$ & have a high chance it might reject again. But if this breaks, that's gonna be huge I guess becoz of the consolidation under the resistance for long time.

Stop Gambling And Start Investing...Google Will Gap In 2 DaysIts important that you start looking at the stock market as an investor.
You see its all in the #3 step in the rocket booster strategy.
Listen once you understand that gap-up part of NASDAQ:GOOGL
Then you have unlocked the secret to trading for a profit.
Understanding the last step is very hard.
But once i understand this step.It was like a light
to my feet on the journey to trading.
The hidden secret is in the promoters that promote the
stock this promotion cycle my mentor Tim Sykes calls it the
Seven Step framework.
If you want to understand this last step then you have to learn
more. Behind this last step is the key to your success in trading.
In order to understand this last step you have to invest in yout
knowledge because it won't be a free ride am sorry. You are going
to have to invest in more knowledge.
The best reference i can give you is to study digital marketing, and sales.
Or join a newsletter that is very good and that suits your goals
To learn more rocket boost this content.
Disclaimer: Trading is risky you will lose money
whether you like it or not
please learn risk management
and profit taking strategies.

Here Is The Method That Is Helping Google Stock To Gap in 2 DaysA stock gapping up is very important.Its easy for you to look
at the last step of the rocket booster strategy and think,
“This last step won't happen”
“What if it doesn't gap up?”
Listen to me NASDAQ:GOOGL has to gap up.In fact this gap should appear
on all the financial markets' news, blogs, and channels.
Hopefully, you have subscribed to at least one financial newsletter.
Worst case scenario your broker has a newsletter.
Listen this gap has to happen, at least 5% gap on the worst day.
But nothing lower than that.
If you want to trade without a gap up that's okay you
can go right ahead and “swing” trade.But if you want a ride
that will give you a better thrill then take the gap-up ride in the rocket
This gap up will boost your knowledge of market psychology which
is the king of trading the stock market.
This is what will give you an investing mentality in trading read the next article below title:S top Gambling And Start Investing...Google Will Gap In 2 Days
Disclaimer: Trading is risky you will lose money
whether you like it or not
please learn risk management
and profit taking strategies.
The 3 Secrets Of Google StockThis past week has a hectic ride in the stock market
plus energy price are rising so high.
When i first saw Google NASDAQ:GOOGL on my screener, it was hard for me
to visualise this price going up.
You see in the past i once thought of buying Netflix stock.
But i doubted the strategy,
I felt like I hit a barrier to entry when it comes to trading
“Will i make money from this trading business?” I thought to myself.
If you want to make a killing in the market then you
need a strategy.
A trend following strategy this strategy is called the
Rocket booster Strategy
1. Price has to be above the 50 MA
2. Price has to be above the 200 MA
3. Price has to gap up
To learn more read the next article
below titled :Here Is The Method That Is Helping
Google Sock To Gap Up in 2 Days
Disclaimer: Trading is risky you will lose money
whether you like it or not
please learn risk management
and profit taking strategies.
