3 Reasons Why Goldman Sachs (GS) Still Looks Bullish🚀 3 Reasons Why Goldman Sachs (GS) Still Looks Bullish (Despite a Bearish Candle)
Goldman Sachs is in a bullish trend, but the latest candlestick is flashing a warning. Here's why GS still looks strong — and what to watch for next 📈
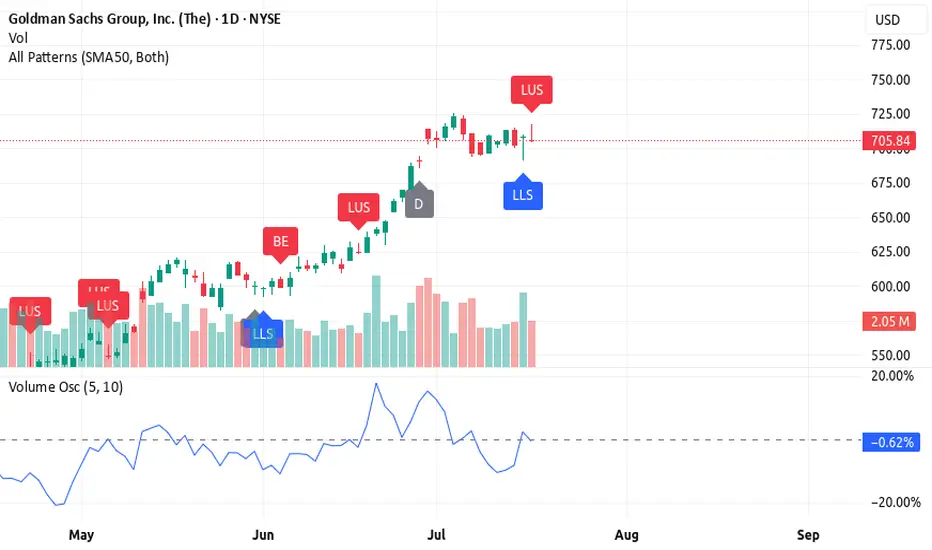
1️⃣ Candlestick pattern – long upper shadow
The long upper shadow shows sellers pushed the price down from the highs, signaling resistance. While bearish short-term, it often happens during strong trends as the market breathes before pushing higher.
2️⃣ High volume on a bearish candle
The negative volume shows resistance, but it may actually represent bear exhaustion. High volume without a breakdown
suggests bears tried to push it down — and failed. Classic fake-out.
3️⃣ Volume oscillator still rising
Despite the pullback candle, the volume oscillator is holding above zero and trending up, showing momentum is still on the bulls' side.
🔥 Rocket Booster Strategy still intact
✅ Price above 50 EMA
✅ Price above 200 EMA
⚠️ Just a temporary shakeout? If the next candle confirms support, GS may continue the bullish push.
⚠️ Disclaimer: Always use a simulation (demo) account before trading with real money. Learn proper risk management and profit-taking strategies to protect your capital.
GS trade ideas
GS SELL overbought GS and JPM are both overbought here. This market is a bubble like we've never seen the valuations are pie in the sky. Id sell calls here as we'll have a correction on these two names in the next couple of weeks. GS 4 hour chart is a screaming SELL

The Return Of The 3 Step Rocket Booster StrategyOne thing you can know about me is i desire to learn how to
drive a car.I still dont know how to drive car.
Sometimes i feel safe being driven
on public roads.
But the freedom that comes from owning your own car,
i still dont know how that feels like.
Whats better to do it yourself, or have others do it for you?
When you look at the macro picture.Money is flowing into
the stock market right now.
This is the best time to use the rocket booster strategy.
Right now you can see that the price is right above the
50 EMA.
This is the return of this strategy.Because even though
its simple it does not work all the time.But when it does
you need to be ready to capitalise on it.
So lets dive into what this strategy is.It has 3 steps as follows:
-The price has to be above the 50 EMA
-The price has to be above the 200 EMA
-The price has to Gap up In A Trend*
*In this case on the macro level the money is moving
into the stock market.
This is very important for you to remember
because another time like this will return.
So you have to take action now before its too
late.
In order to see what happens enter a buy position
using your simulation trading account.
Rocket boost this content to learn more.
Disclaimer:Trading is risky please learn
risk management and profit taking strategies.
Also feel free to use a simulation trading
account before you trade with real money.

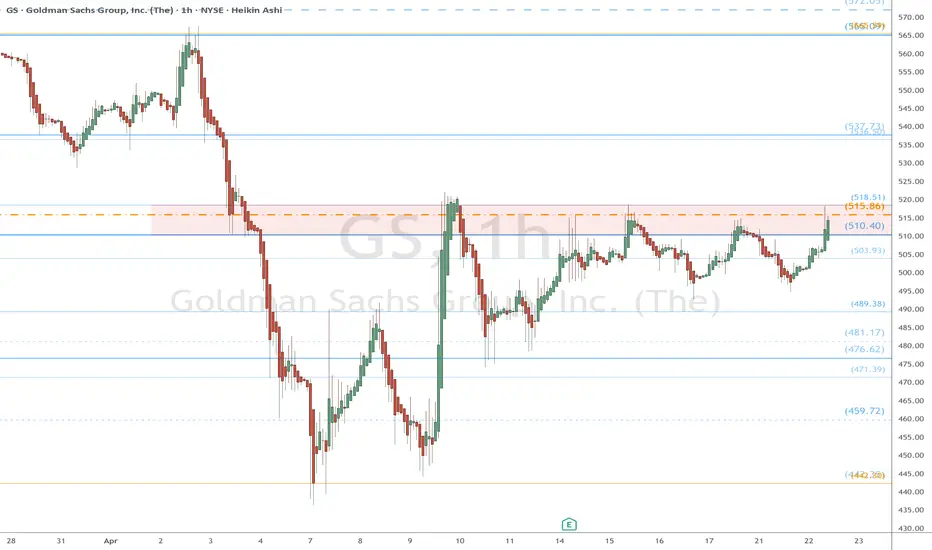
GS watch $515-518: Minor but key Resistance to determine trend GS and all banks trying to recover their pre-tariff strength.
Currently testing a well proven resistance at $515.86-518.51
Looking for a Rejection or Break-n-Retest of zone for entries.
Goldman Sachs (GS): Long Position Opportunity Amid Stabilizing V
-Key Insights: Goldman Sachs (GS) stands to benefit from stabilizing market
volatility, as reflected by the declining VIX. While macroeconomic uncertainties
and earnings season pressures persist, GS has room for recovery with strong
potential upside driven by resilience in financial services and liquidity
movements.
-Price Targets:
-Next Week Targets (Long): T1=$515, T2=$530
-Stop Levels: S1=$500, S2=$485
-Recent Performance: GS has experienced mixed sentiment, with broader pressure
on financials underscoring recent trading activity. Although current price
information is unavailable, GS analysts are optimistic about near-term recovery
potential. Elevated market volatility weighing on sectors like healthcare and
technology continues to influence financial equities indirectly.
-Expert Analysis: Analysts suggest GS may see bullish action in the short term
as markets stabilize and corporations deliver earnings guidance. With the VIX
trending lower and macro risks easing, GS has a positive outlook tied to sector
earnings. However, caution remains due to broader geopolitical risks and
lingering effects from trade restrictions and inflation pressures.
-News Impact: Key events such as United Healthcare’s earnings revisions have
rippled across Dow components, pressuring financial stocks. Additionally,
Nvidia’s export control challenges highlight vulnerabilities in global markets,
which could indirectly affect GS’s portfolio exposure to related industries.
Anticipated volatility from Tesla and Alphabet’s earnings next week may also
influence market sentiment tied to GS’s stock movement.

4/14/25 - $gs - A buy4/14/25 :: VROCKSTAR :: NYSE:GS
A buy
- 1.5x book w/ mid teens ROEs.
- 11x PE
- great result
- financials will do well in this environment
- not a tariff punching bag
- all the financial services should supplement IPO/ IB issues in the ST
- trying to keep cash high
- but you could get 3% yield on a 2 week expiry at $500 stirke
- or cash secured puts for about 2% yield on the week $500 strike
- but for now i'm just playing other stuff
- though i'd like to dip buy this on the next sell off if/when bc i'd like to start growing financials exposure in my book this year (which i think does well in this environment)
V

Just In: The Goldman Sachs Group, Inc. (GS) Set for Breakout The Goldman Sachs Group, Inc. (GS) shares is set for a breakout today as the firm smashes Q1 Estimates leading to a 2.45% surge in Monday's premarket trading.
Reports Overview
Goldman Sachs delivered a strong first-quarter performance, beating Wall Street expectations on both earnings and revenue, thanks to a record-setting quarter in equities trading. The bank posted earnings of $14.12 per share versus an expected $12.35, with revenue reaching $15.06 billion compared to forecasts of $14.81 billion.
Financial Performance
In 2024, The Goldman Sachs Group's revenue was $52.16 billion, an increase of 15.34% compared to the previous year's $45.23 billion. Earnings were $13.48 billion, an increase of 71.52%.
Analyst Forecast
According to 16 analysts, the average rating for GS stock is "Buy." The 12-month stock price forecast is $593.43, which is an increase of 20.02% from the latest price.
Technical Outlook
Prior our last analysis on NYSE:GS stock, the asset is already approaching the short term resistant point and a break above that pivot would cement the path for a bullish campaign for NYSE:GS shares . As hinted by the RSI at 43, NYSE:GS shares has more room to capitalize on the dip and pull on a bullish campaign today.
All eyes are set on the $520 level, should NYSE:GS shares break that pivot, a bullish breakout might be inevitable.
"Trip of Sache Sellers Crab" is still ongoing.Alright folks, let's talk Goldman Sachs.
They're dropping their earnings report tomorrow, which means Wall Street's gonna be buzzing like a caffeinated hive. Are we ready for a bullish breakout? A bearish beatdown? Honestly, your guess is as good as mine.I’m about as fundamentally clueless as a goldfish in a shark tank.
But fear not! (Or fear slightly, depending on your risk tolerance).
According to our resident "technically proficient" (and slightly cryptic) fortune teller Crab , the "Trip of Sache Sellers Crab" isn't finished yet.
Apparently, that translates to: $375 is the magic number to buy in.

Goldman Sachs Raises Recession Odds to 35% Amid Tariff Fears Goldman Sachs (NYSE: GS) has lowered its S&P 500 year-end target again. The firm now sees the index ending at 5,700 points, down from its earlier forecast of 6,200. This revision comes just days before President Trump’s new round of tariffs is set to begin. The updated target implies only a 2% gain from Friday’s close of approximately 5,597.
Chief U.S. Equity Strategist David Kostin pointed to rising tariffs and slowing economic growth as key concerns. The revised forecast reflects a cautious outlook in light of economic risks. This is the second time Goldman has slashed its target this month.
At the same time, Goldman Sachs has raised its 12-month recession probability to 35%, up from a previous 20%. Chief Economist Jan Hatzius explained that higher tariffs and softening economic data contributed to the decision. Goldman now estimates the average U.S. tariff rate will rise to 15% in 2025, compared to an earlier projection of 10%.
Alongside these changes, the bank has cut its Q4 2025 U.S. GDP growth forecast to 1.0% from 1.5%. The adjustment follows weakening household and business confidence. Recent White House comments also suggest officials may accept short-term economic strain to pursue long-term trade objectives.
These developments reflect growing concern across Wall Street. Goldman’s 5,700 target ranks among the lowest of major forecasts. With markets already on edge, the new projection underscores broader fears over trade tensions and economic resilience.
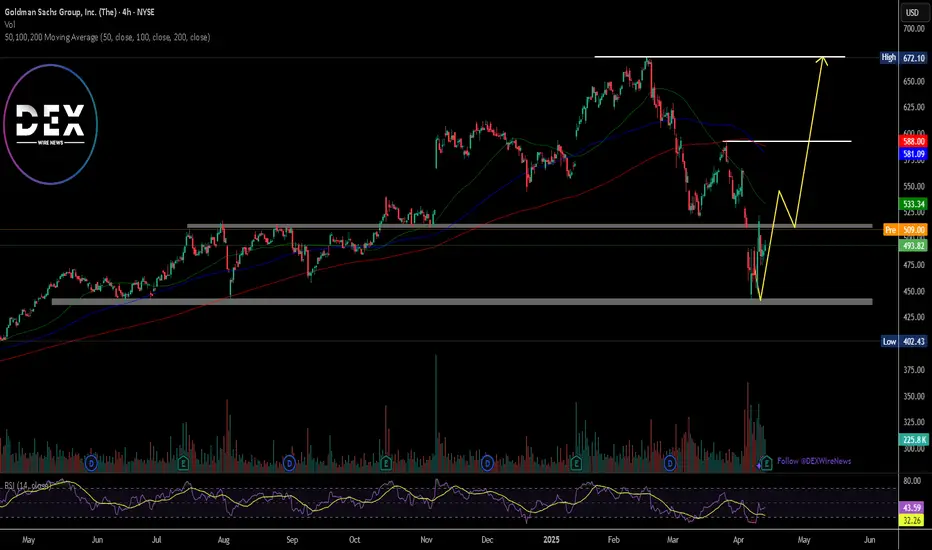
Technical Analysis: Bearish Momentum Below $500
The S&P 500 has turned bearish after falling below a key support at $510. This level had held firm previously but now acts as resistance. The break and close below the key level signals strong bearish pressure and there is a possibility of more bearish momentum.
Price is currently trending lower towards the next potential support at $440. If it breaks below it, further drop could follow. The bearish pressure may continue unless the bulls defend the key support level.
However, if the bulls can finally defend the $440 level, it could potentially recover and target $510. In that case, the first resistance to overcome is $510. If it is also broken above, the next target would be the $592 resistance zone. A break above $592 could revive bullish momentum.
As of April 4th 2025, Goldman Sachs stock closed at $21.74, down 1.50% on the day. Investors await further updates ahead of the earnings report due April 14th 2025.

Goldman Sachs Earnings Tomorrow – Ready for a Bullish Breakout?Goldman Sachs (NYSE: GS) is shaping up for a potential bullish move ahead of its earnings report tomorrow (January 15) before the market opens. With the stock bouncing off key support levels and positive momentum indicators, a strong earnings surprise could trigger further upside toward my targets.
Let’s break down the setup:
💼 Trade Setup for Swing Trade:
🔹 Entry Price: $569 (current price)
🎯 Take Profit 1: $600
🎯 Take Profit 2: $625
🎯 Take Profit 3: $650
🛡️ Stop Loss: $540 (below key support)
📈 Why Am I Bullish on Goldman Sachs?
1️⃣ Earnings Catalyst (January 15, Pre-Market)
Goldman Sachs will release its Q4 2024 earnings tomorrow before the market opens. Historically, the bank has outperformed expectations, particularly in trading revenues and fixed income.
Given the recent recovery in capital markets, there’s a good chance Goldman will report higher-than-expected revenues, which could trigger a sharp rally.
2️⃣ Technical Reversal in Play
GS is bouncing off a key support zone near $550, which has acted as demand multiple times in the past. The RSI is rising from oversold levels, and Stochastic has turned bullish, suggesting momentum is building.
A break above $575 would confirm the reversal and open the door to higher targets at $600, $625, and $650.
3️⃣ Valuation and Undervaluation
Goldman Sachs is trading at a P/E ratio of 16.8, which is cheaper than peers like JPMorgan and Morgan Stanley. This leaves room for valuation expansion, especially if the bank delivers positive earnings surprises.
With recovering trading volumes, M&A activity, and IPO deals, GS could see a significant boost to revenue and profitability.
💡 Final Thoughts:
Goldman Sachs is setting up for a potential bullish move, with a solid technical and fundamental backdrop. The upcoming earnings report is a key catalyst that could trigger strong upside if results beat expectations.
I’m targeting $600, $625, and $650, while managing risk with a stop loss at $540. Let's see how it plays out!
💬 What do you think? Are you bullish on Goldman Sachs too? Drop your thoughts in the comments! 👇

Goldman Sachs Wave Analysis – 25 March 2025
- Goldman Sachs continues daily uptrend
- Likely to rise to resistance level 600.00
Goldman Sachs continues to rise inside the B-wave of the medium-term ABC correction (4) from the end of February.
The active wave B started earlier from the support zone between the support levels 520.00 (former monthly low from December) and 540.00.
Given the clear daily uptrend, Goldman Sachs can be expected to rise to the next round resistance level 600.00.

Goldman Sachs - Too Cheap to Ignore?NYSE:GS and the general financial services sector as a whole has faced extreme trauma over this past month. However, one that particularly stands out is the "bad guy" of the industry who has taken the equivalent to a roundhouse kick to the face, and the chart shows it. But does this mean that someone looking for a dip shouldn't pick up strong equity on a discount? I say no, lets be greedy while other are fearful just like that one guy said. Warren something... I don't really remember his name.
Let's examine the numbers before we do the finance equivalent of astrology. This means that value investing and it's rather elementary techniques are going to give us some sort of indicator of a buy or a sell. Here's what you need to know.
1. Sachs has an attractive dividend yield of 2.14% ($11.50/share) and a gleaming dividend payout ratio (DPR) of 21.50%.
2. It is far from its high annual EPS sitting at 41.21 sliding from its high last December at 60.35.
3. It's price to earnings ratio (PE) is lounging nicely at 14.00 meaning we are at a generally cheap share price. This metric is what we're looking for.
4. Unfortunately, it has a rather higher price to book ratio (PB) at 1.64 which somewhat contradicts the PE ratio examined in #3.
5. Other metrics to keep in mind is an EV/EBITDA at 53.90 and a PEG at 16.23 which are both considered undesirable to investors.
So as far as statistics are concerned, Goldman is sending some mixed signals making a decision difficult at the moment. This means we're going to have to examine the general sector sentiment and general outlook.
Firstly, I'd like to point out Goldman's enterprise value. Sachs' EV is currently reported at 855.93 billion, 673 billion (78.63%) being debt (long term or short). This means NYSE:GS is a debt heavy company and we all know how debt works (the entity taking on the debt owes principal + interest). Well, this means that NYSE:GS is heavily going to be influenced by interest rates even considering their strong revenue. So, if we plan on interest rates being lowered long term (which I'm sure we all do), Goldman will be able to borrow from the Fed at a cheaper interest price while simultaneously owing account holders and bond holders less in interest (or APY yield for that matter). However, in the event that inflation runs wild and the Fed raises rates, NYSE:GS will face some turmoil along with the other commercial investment banks.
Great, so now for the fun part. Let's see what the charts have to say about this and what it could be implying.
Here is the 4H chart looking back into last October.
As you can see, Goldman posted a sweet rally followed by our current pullback. However, we are being flashed with various bullish technical patterns and a strong explanation for the drop (even considering the tariffs threats and indices pullback). In summary, we are examining a stock in gradual freefall towards what appears to be several safety nets.
On a psychological level, I find that most investors in the business of "smart money" wont let Goldman drop too low before they put their boot down. I also imagine this will happen pretty soon, but we need to hold the $540 price level.
As far as the MACD is concerned, we are experiencing weakness from the buyers are the bears are clearly on offense.
And lastly, the GS implied volatility shows that options traders aren't pricing in anything particularly unusual, and the most usual movement for the market is to climb higher so that's good news.
So, what's the conclusion. In my humble opinion, I believe that Goldman Sachs' stock is trading too low to not buy. Financially, the company is not showing anything particularly concerning and may just need to show some strength before the mass cash chases this play. As of right now, I am long on NYSE:GS considering the financial statistics, general industry sentiment, and technical analysis which was used as an assistance tool. This trade could be last anywhere from 1 day to 1 year, but I am prepared to hold for much longer.

Goldman Pulls BackGoldman Sachs hit a new high two weeks ago, and some traders may see opportunities in its latest pullback.
The first pattern on today’s chart is the November high around $613. The Wall Street giant is apparently stabilizing at that level. Has old resistance become new support?
Second, stochastics have dipped to an oversold condition.
Third, GS gapped higher after its last earnings report on January 15. That may reflect strong fundamentals.
Finally, GS is trying to hold its 50-day simple moving average (SMA). The 100-day is also rising from below. Both of those patterns may be consistent with a bullish uptrend.
TradeStation has, for decades, advanced the trading industry, providing access to stocks, options and futures. If you're born to trade, we could be for you. See our Overview for more.
Past performance, whether actual or indicated by historical tests of strategies, is no guarantee of future performance or success. There is a possibility that you may sustain a loss equal to or greater than your entire investment regardless of which asset class you trade (equities, options or futures); therefore, you should not invest or risk money that you cannot afford to lose. Online trading is not suitable for all investors. View the document titled Characteristics and Risks of Standardized Options at www.TradeStation.com . Before trading any asset class, customers must read the relevant risk disclosure statements on www.TradeStation.com . System access and trade placement and execution may be delayed or fail due to market volatility and volume, quote delays, system and software errors, Internet traffic, outages and other factors.
Securities and futures trading is offered to self-directed customers by TradeStation Securities, Inc., a broker-dealer registered with the Securities and Exchange Commission and a futures commission merchant licensed with the Commodity Futures Trading Commission). TradeStation Securities is a member of the Financial Industry Regulatory Authority, the National Futures Association, and a number of exchanges.
TradeStation Securities, Inc. and TradeStation Technologies, Inc. are each wholly owned subsidiaries of TradeStation Group, Inc., both operating, and providing products and services, under the TradeStation brand and trademark. When applying for, or purchasing, accounts, subscriptions, products and services, it is important that you know which company you will be dealing with. Visit www.TradeStation.com for further important information explaining what this means.

The Best 3 Shocking Chart Patterns The Best 3 Shocking Chart Patterns Using The Rocket Booster Strategy..
-
Again am trying to get understand how to trade the options markets
and let me tell you i have not
had a good night's rest for the past 5 days!
Trying to combine the rocket booster strategy
with candle-sick patterns
Honestly, i didn't think
i would master options trading
Because basically am a commodity
trading expert
Specializing in buying bitcoin
As you venture into mastering options
trading to increase your income
you will find these top 3
candlestick patterns
you should know about:
-The 3 Outside Up
-Bullish Engulfing
-The Rising 3 Soldiers NYSE:GS
Will more of them appear?
not so
But watch this space for another
week
Let me also share with you
the rocket booster strategy
which has 3 steps
-The price has to be above the 50 Day moving average
-The price has to be above the 200 Day moving average
-The price has to gap up in a trend
That last step is important because that's the step
That will show you the candle stick
pattern you may be looking for.
To learn more Rocket Boost this content
Disclaimer: Trading is risky please learn
risk management and profit-taking
strategies
Also feel free to
use a simulation trading
account before you trade with
real money

Goldman Sachs.
One last piece remaining in GS before a meaningful correction. That the max extension in time shown.

Decent long on GS for about 12%The chart I published shows that from the covid lows until Sept 2021 GS went on a MONSTER RUN. Then the 2022 correction ( JUST DIDNT FEEL LIKE A BEAR MARKET) allowed for some profit taking and accumulation from the smart money AKA institutions. We are late on the break-out since Goldman broke out in April/May of 2024 but thats ok bc there is still alot of upside left.
By my calculations there is close to 12% until we run into any real trouble. I will be taking this trade if I can get the entry I am looking for. I am not telling you to and I never will. I am not your daddy and I never will be.
If you like my ideals you can always copy them as your own but understand they will then be your own ideals.
I am here to share my experience and help people become better investors and traders. The first step in that direction is to understand that losses are nothing more than Market tuition and in trading/investing it will always be your fault and no one elses.
You reap all the glory and you are responsible for all the pain.
GoodLuck My fellow Traders!

GS Testing Channel Resistance! Key Trade Setups for TomorrowAnalysis:
Goldman Sachs (GS) is approaching the upper boundary of its rising channel near $628, suggesting a potential for either a breakout or a rejection. The stock has shown strong upward momentum, rallying from the $556 support level. The MACD remains bullish, although the histogram is flattening, indicating slowing momentum. Meanwhile, the Stochastic RSI is nearing overbought levels, hinting at a possible pullback or consolidation.
Volume remains consistent, supporting the uptrend, but traders should watch closely as the stock approaches a critical resistance zone.
Key Levels to Watch:
* Resistance Levels:
* $628: Immediate resistance at the current price level, aligning with the upper channel boundary.
* $630-$635: Extended resistance zone if momentum continues.
* Support Levels:
* $620: Near-term support level within the rising channel.
* $600: Key psychological and technical support.
* $556-$560: Strong downside support, aligning with previous lows.
GEX Insights:
* Gamma Exposure (GEX):
* Positive GEX peaks at $630, signaling strong resistance.
* Support zones are solid at $600 due to substantial negative GEX positioning.
* Options Activity:
* IVR: Moderate, reflecting steady implied volatility.
* Call/Put Ratio: Leaning bullish, but resistance overhead may limit gains.
Trade Scenarios:
Bullish Scenario:
* Entry: Break above $628 with increasing volume.
* Target: $635 (first target), $640 (extended target).
* Stop-Loss: Below $620.
Bearish Scenario:
* Entry: Rejection near $628 with bearish price action.
* Target: $620 (first target), $600 (extended target).
* Stop-Loss: Above $630.
Directional Bias:
The bias is cautiously bullish as GS continues to trend higher within its rising channel. However, the $628-$630 zone poses significant resistance, and a failure to break above this level may result in a pullback toward $620 or lower.
Disclaimer: This analysis is for educational purposes only and does not constitute financial advice. Always do your own research and manage your risk before trading.

Long on Goldman Sachs: Capitalize on Earnings Momentum Next Week- Key Insights: Goldman Sachs is positioned for potential upside next week as
its upcoming earnings report is expected to act as a catalyst for market
movement. The overall positive sentiment in the financial sector, driven by
strong bank earnings, suggests that if Goldman reports in line with or above
expectations, it could bring investor confidence back into focus. Watch
closely for market reactions particularly influenced by inflation data and
interest rates, as these factors will anchor performance in the upcoming
period.
- Price Targets: Next week targets are set as follows: T1 at 645, T2 at 660. For
stop levels, S1 at 610 and S2 at 595.
- Recent Performance: Goldman Sachs has shown resilience in recent trading
sessions, reflecting broader market trends in the financial sector while
benefiting from positive earnings reports from peers. The stock maintains a
pivotal role in shaping market sentiment with its performance closely tied
to key economic indicators.
- Expert Analysis: Analysts express a cautiously optimistic view surrounding
Goldman Sachs, highlighting the importance of upcoming earnings. While there
is concern over potential overvaluation, many believe the bank's
fundamentals remain strong, and solid earnings could validate current market
enthusiasm. The consensus suggests a need for robust performance to
reinforce long-term bullish sentiments.
- News Impact: The imminent quarterly earnings announcement for Goldman Sachs is
generating significant attention, with expectations that it will provide
insights into the overall health of the financial sector. Additionally, the
backdrop of consumer spending and inflation stabilization could enhance the
bank's performance prospects. Market participants should be aware of
interrelated impacts from competing company earnings in both the financial
and technology sectors that may influence overall market behavior.

Goldman Sachs... GS looks like a top unless they pump moreLike the prior Idea of mine...most things have given back the Trump-bump election push and are on the way down or skating on thin ice and ready to begin a hard fall.
This has shown similar patterns from previous times.
The lines are hull moving averages or averages that are envelope or 3x exponential. mix them together and you get predictors that are pretty good in general.

Goldman Sachs ... simple levels, earnings and future tradeUsing simple lines that are from key pivot points and using a "Bow string method"- taking a fib channel and connecting to highs or lows and putting the third point of the channel tool on the lowest or highest point between the first two highs or lows respectively.
You can see a top may of been in along the top line...granted it was due to the election crack up boom attempt number 1...probably 4 more coming to try and prop things up.
Anywho...here are all the touches to show congruence back to 2009...the last time a crap load free-falled into the bowl that is the economic market.
Check out the Minds on here about GS I'll put up for more analysis showing why i say that top line is quite significant...

GS The Goldman Sachs Group Options Ahead of EarningsIf you haven`t bought the dip on GS:
Now analyzing the options chain and the chart patterns of GS The Goldman Sachs Group prior to the earnings report this week,
I would consider purchasing the 555usd strike price Puts with
an expiration date of 2025-1-17,
for a premium of approximately $4.60.
If these options prove to be profitable prior to the earnings release, I would sell at least half of them.

Goldman Sachs ($GS): Trend Channel in FocusGoldman Sachs has been trending higher since our analysis two months ago, prompting us to reevaluate our stance. We’ve concluded that it makes more sense to remain bullish for now and not anticipate a bearish scenario at this stage. We are particularly encouraged by how consistently NYSE:GS has respected its trend channel, which strengthens our belief that it will continue to hold. However, there is a significant concern: we don’t want to see NYSE:GS losing this trend channel or creating a false breakdown, only to trap bears and continue higher.
Goldman Sachs has its earnings call scheduled for the same day as BlackRock and JP Morgan this Wednesday. This adds pressure, and with additional uncertainty from the upcoming political shifts, such as the inauguration of Trump, the potential impact on NYSE:GS , NYSE:BLK , and NYSE:JPM remains unclear.
Setting a limit at the 23.6%-38.2% Fibonacci levels feels too risky given the current environment and the uncertainty in the near future. While we favor this updated bullish scenario over the previous one, the bearish scenario isn’t entirely off the table. It could quickly come back into play if NYSE:GS loses key support levels.
For now, NYSE:GS needs to touch the $536–$489 zone and reclaim the trend channel promptly to validate our bullish scenario. If it fails to do so, we’ll need to approach with extreme caution, and as a result, we are not rushing into a trade at the moment.

Anticipating a Drop on Goldman. GSIt is looking like a start of Wave 3 or C, as per Elliott. We are inclined to believe that the drop will be impulsive, secondary to a short time in the correction post Wave 1 (or A), suggesting Wave 2 completion, rather than B. Technically, stochastics and volatility zones are about to flip, momentum down going. Also, there is a cross of both the Smoother by Ehlers and MIDAS curve. This is a highly suggestive bearish picture from and eagle's eye view. Aiming to reverse position in the event of contralateral MIDAS curve cross.
