HDFC BuyNSE:HDFCBANK an uptrend after a short testing of support and/or consolidation at support leves
HDB/N trade ideas


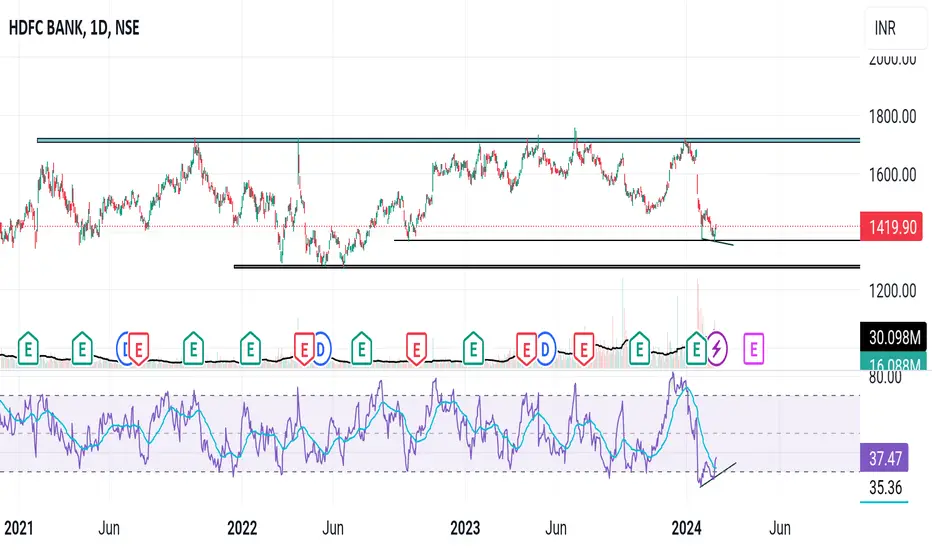
HDFC BANK S/R for 1/3/24Support and Resistance Levels:
Based on the price action, you have to identify two significant levels: the red line acting as resistance and the green line acting as support. Additionally, there have marked red and green shades to represent resistance and support zones, respectively.
Support: The green line and green shade represent support levels. These levels are where the price tends to find buying interest, preventing it from falling further. Traders can consider these levels as potential buying opportunities.
Resistance: The red line and red shade represent resistance levels. These levels are where the price tends to encounter selling pressure, preventing it from rising further. Traders can consider these levels as potential selling opportunities.
Breakouts: If the price breaks above the resistance zone (red shade) convincingly, it may indicate a bullish breakout, and the price could move higher to the next resistance level. On the other hand, if the price breaks below the support zone (green shade) convincingly, it may indicate a bearish breakout, and the price could move lower to the next support level.
Keltner Channel:
The Keltner Channel is a technical indicator that uses an exponential moving average (EMA) to create an upper and lower channel around the price action. Traders can use this channel to identify potential long and short positions.
Long Position: If the price is above the upper line of the Keltner Channel, it may indicate a potential long opportunity, as it suggests the price is trading above the average range and might continue in an upward trend.
Short Position: If the price is below the lower line of the Keltner Channel, it may indicate a potential short opportunity, as it suggests the price is trading below the average range and might continue in a downward trend.
Disclosure: I am not SEBI registered. I just wanted to let you know that the information provided here is for learning purposes only. Please consult your financial advisor before making any decisions. Tweets neither advice nor endorsement.


HDFC BANK touching its lowHDfc BANK has been continuously been in the free fall and touching its all low in this we are watching how it is getting low and it is creating a space for the investors to in and it is a good entry level. will not recommend otheres to buy , you should ask yourself why should i buy this on others recommendation.

HDFC BANK S/R for 28/2/24Support and Resistance Levels:
Based on the price action, you have to identify two significant levels: the red line acting as resistance and the green line acting as support. Additionally, there have marked red and green shades to represent resistance and support zones, respectively.
Support: The green line and green shade represent support levels. These levels are where the price tends to find buying interest, preventing it from falling further. Traders can consider these levels as potential buying opportunities.
Resistance: The red line and red shade represent resistance levels. These levels are where the price tends to encounter selling pressure, preventing it from rising further. Traders can consider these levels as potential selling opportunities.
Breakouts: If the price breaks above the resistance zone (red shade) convincingly, it may indicate a bullish breakout, and the price could move higher to the next resistance level. On the other hand, if the price breaks below the support zone (green shade) convincingly, it may indicate a bearish breakout, and the price could move lower to the next support level.
Keltner Channel:
The Keltner Channel is a technical indicator that uses an exponential moving average (EMA) to create an upper and lower channel around the price action. Traders can use this channel to identify potential long and short positions.
Long Position: If the price is above the upper line of the Keltner Channel, it may indicate a potential long opportunity, as it suggests the price is trading above the average range and might continue in an upward trend.
Short Position: If the price is below the lower line of the Keltner Channel, it may indicate a potential short opportunity, as it suggests the price is trading below the average range and might continue in a downward trend.
Disclosure: I am not SEBI registered. I just wanted to let you know that the information provided here is for learning purposes only. Please consult your financial advisor before making any decisions. Tweets neither advice nor endorsement.

HDFC BANKHDFC BANK Monthly chart Ascending Triangle Pattern it break the trendline be careful if will break 1250 then go short 1Target 1152 & 2Target 711..

HDFC Bank - Live market update
Support of HDFC is rising but it has to enter and stabilize in white channel.
Disclaimer:
I am not a SEBI Registered Analyst and it is only for educational purposes. Please consult your financial advisor before making any decision.

HDFC BANK S/R for 22/2/24Support and Resistance Levels:
Based on the price action, you have to identify two significant levels: the red line acting as resistance and the green line acting as support. Additionally, there have marked red and green shades to represent resistance and support zones, respectively.
Support: The green line and green shade represent support levels. These levels are where the price tends to find buying interest, preventing it from falling further. Traders can consider these levels as potential buying opportunities.
Resistance: The red line and red shade represent resistance levels. These levels are where the price tends to encounter selling pressure, preventing it from rising further. Traders can consider these levels as potential selling opportunities.
Breakouts: If the price breaks above the resistance zone (red shade) convincingly, it may indicate a bullish breakout, and the price could move higher to the next resistance level. On the other hand, if the price breaks below the support zone (green shade) convincingly, it may indicate a bearish breakout, and the price could move lower to the next support level.
Keltner Channel:
The Keltner Channel is a technical indicator that uses an exponential moving average (EMA) to create an upper and lower channel around the price action. Traders can use this channel to identify potential long and short positions.
Long Position: If the price is above the upper line of the Keltner Channel, it may indicate a potential long opportunity, as it suggests the price is trading above the average range and might continue in an upward trend.
Short Position: If the price is below the lower line of the Keltner Channel, it may indicate a potential short opportunity, as it suggests the price is trading below the average range and might continue in a downward trend.
Disclosure: I am not SEBI registered. I just wanted to let you know that the information provided here is for learning purposes only. Please consult your financial advisor before making any decisions. Tweets neither advice nor endorsement.

Buy for target of 1470HDFC bk round bottom one can buy above 1427 with sl 1399 for the target of 1470

HDFC Bank - Is it the end of the fall - Daily chart reversalHDFC Bank Q chart. Top private sector bank. 3Y consolidation and is at the support of the trendline Feb 12. RSI(34) is below 70. Weekly chart formed Lower Low on Feb 12. This chart was previously shared.
Following up with this Quarterly chart, posting daily chart of HDFC bank in comparison with Nifty Private sector bank RSI & MACD. Rate of change of HDFC bank is above 0. While the oscillators showing positive sign, moving averages are yet to give positive sign.
However, if you've noticed quarterly chart, hdfc bank seems to have taken the support of the trendline. Also, in daily chart, white Marubozu candlestick can be seen on Feb 15. And Price is above Parabolic SAR value.

HDFC BANK S/R for 21/2/24Support and Resistance Levels:
Based on the price action, you have to identify two significant levels: the red line acting as resistance and the green line acting as support. Additionally, there have marked red and green shades to represent resistance and support zones, respectively.
Support: The green line and green shade represent support levels. These levels are where the price tends to find buying interest, preventing it from falling further. Traders can consider these levels as potential buying opportunities.
Resistance: The red line and red shade represent resistance levels. These levels are where the price tends to encounter selling pressure, preventing it from rising further. Traders can consider these levels as potential selling opportunities.
Breakouts: If the price breaks above the resistance zone (red shade) convincingly, it may indicate a bullish breakout, and the price could move higher to the next resistance level. On the other hand, if the price breaks below the support zone (green shade) convincingly, it may indicate a bearish breakout, and the price could move lower to the next support level.
Keltner Channel:
The Keltner Channel is a technical indicator that uses an exponential moving average (EMA) to create an upper and lower channel around the price action. Traders can use this channel to identify potential long and short positions.
Long Position: If the price is above the upper line of the Keltner Channel, it may indicate a potential long opportunity, as it suggests the price is trading above the average range and might continue in an upward trend.
Short Position: If the price is below the lower line of the Keltner Channel, it may indicate a potential short opportunity, as it suggests the price is trading below the average range and might continue in a downward trend.
Disclosure: I am not SEBI registered. I just wanted to let you know that the information provided here is for learning purposes only. Please consult your financial advisor before making any decisions. Tweets neither advice nor endorsement.

HDFC Bank Q chart at the support of trendline HDFC Bank Q chart. Top private sector bank. 3Y consolidation and is at the support of the trendline Feb 12. RSI(34) is below 70. Weekly chart formed Lower Low on Feb 12.

Reversal of HDFCBank !!With a clear divergence in daily time frame. Hdfcbank can gain 100-150 points in upcoming days.

Short term 1420-1435 range possibleThe stock might take support at this level consolidate for some time and trade in the range of around 1420-1435 for the short term my view.
RSI oversold on daily chart 23 lvls

HDFCBANK Analysisprice broken the bearish trendline, while breaking the trendline price leaves a demand zone on bottom side.
so wait until price test the demand zone and go for long entry in HDFCBANK.
Mark the targets on topside every intersection points to the trendline.
If price breaks the bottom side demand zones, by consolidating between the demand and support zone price will breaks the support.
so until it breaks the demand zone look for long side.

HDFC short Bearish Target 700-800HDFC is showing bearish sign after in month of consolation seem in 6 month this share easy Touch down Trendline if 700-800
For quits trader it's time to exit if market below than this level 5% stop less from 700-800 rs easy target
For option trader -- take a PE call 1250 and every reversal book profit and enter in PE till 700-800 zone
For more chart analysis comment me in this post.

HDFC Bearish Short call PE1250HDFC is showing bearish sign after in month of consolation seem in 6 month this share easy Touch down Trendline if 700-800
For quits trader it's time to exit if market below than this level 5% stop less --- from 700-800 rs easy target
For option trader -- take a PE call 1250 and every reversal book profit and enter in PE till 700-800 zone
For more chart analysis comment me in this post.

HDFC BANK S/R for 19/2/24Support and Resistance Levels:
Based on the price action, you have to identify two significant levels: the red line acting as resistance and the green line acting as support. Additionally, there have marked red and green shades to represent resistance and support zones, respectively.
Support: The green line and green shade represent support levels. These levels are where the price tends to find buying interest, preventing it from falling further. Traders can consider these levels as potential buying opportunities.
Resistance: The red line and red shade represent resistance levels. These levels are where the price tends to encounter selling pressure, preventing it from rising further. Traders can consider these levels as potential selling opportunities.
Breakouts: If the price breaks above the resistance zone (red shade) convincingly, it may indicate a bullish breakout, and the price could move higher to the next resistance level. On the other hand, if the price breaks below the support zone (green shade) convincingly, it may indicate a bearish breakout, and the price could move lower to the next support level.
Keltner Channel:
The Keltner Channel is a technical indicator that uses an exponential moving average (EMA) to create an upper and lower channel around the price action. Traders can use this channel to identify potential long and short positions.
Long Position: If the price is above the upper line of the Keltner Channel, it may indicate a potential long opportunity, as it suggests the price is trading above the average range and might continue in an upward trend.
Short Position: If the price is below the lower line of the Keltner Channel, it may indicate a potential short opportunity, as it suggests the price is trading below the average range and might continue in a downward trend.
Disclosure: I am not SEBI registered. I just wanted to let you know that the information provided here is for learning purposes only. Please consult your financial advisor before making any decisions. Tweets neither advice nor endorsement.

Time for hdfc bankBouncing from support.. bullish divergence..mutual funds accumulating in large amounts..hdfc bank is a giant.. no need of introduction.. best time for investors to enter for target 1700+.. 20%.. for traders sl is 1350 dcb
Short Swing Trade in HDFCBANKEverything is pretty much explained in the picture itself.
For any query kindly dm.
Thank you So Much.

will $NSE:HDFCBANK take support ?Dear Traders,
I hope this message finds you well. I wanted to provide you with a brief update on the stock NSE:HDFCBANK I have been monitoring.
It appears that the stock is approaching a potential Support level Near 1400-1405 This is an important technical point where the price has historically had difficulty breaking through. It suggests that we may see a temporary halt in the current upward momentum and Possibly it will test 1480-1500 In Upmove.
Resistance Levels to Watch out.
Resistance levels are the opposite, representing prices at which a stock has historically struggled to move above. These levels can signal a selling interest. Understanding resistance points is crucial for anticipating potential obstacles in the upward movement of a stock.
R1= 1460
R2= 1520
R3= 1570
Support Levels To Watchout.
Support levels represent prices at which a stock has historically had difficulty falling below. These levels often indicate a strong buying interest. It's important to monitor these levels, as a breach might suggest a potential downward trend.
S1= 1400
S2= 1340
S3= 1280
As always, please remember that investing involves risks, and it's important to carefully consider your options. If you have any questions or would like to discuss this further, please don't hesitate to reach out.
Best regards,

HDFCBANK On Verge of Breaking out - Expecting to Test 1760While rest of the large cap in India market have started to catch up with mid and small caps after the state election results, HDFCBANK caught the fever a bit late and just has started to move breaking the previous resistance. Closing at 1646 on 12/15 - right at the the .61 Fibo level with pivots as Feb '23 high and Q3 Low - support level is well established in this 1610-1646 range and likely going to hold on any unfavorable macro news. On the other, on Monday 12/18, expect move above 1670 pre-market and test around 1696 - a Fibo .78 level within few hours in the day. The RSI is near overbought level at daily, I expect some strong resistance at 1696. However due to strong macro tailwind, eventually this should break and HDFCBANK should test 1721 the previous strong resistance this week itself. If this breaks into all time high of 1760+ to be seen but I will be surprised to see that happen this week.
