HPQ: Bearish Head and Shoulders, Diamond, Dragon, and BAMM ComboHewlett-Packard, after making five macro waves up, has formed a Bearish Structure that can only be described as being a hybrid between a Diamond and a Head and Shoulders pattern, and along with that, it is also a combination of a Bearish Dragon and Bearish BAMM.
All of this is happening after HPQ faced rejection off of the PCZ of a Bearish Crab going into its 5th wave.
Here is a screenshot of the zoomed out chart that showed the biggest macro wave structure that is on the chart and where all of this is happening:
HPQ trade ideas

HPQ : Taking a positionThis purchase was primarily driven by technical analysis. The price was at the lower end of the channel when I entered the trade. Apart from the technical aspects, two other factors piqued my interest. Despite a decline in PC sales, the company maintains a healthy cash flow, and they've been actively using that cash to buy back shares. Some of these buybacks occurred at a price closer to $33.58 per share, which is below my entry point. This further bolsters my decision to initiate this trade. Notably, HPQ is a stock that features in Warren Buffett's portfolio as per his latest 13F filing.
I allocated approximately 2.5% of my capital to this position, and I do not currently have plans to increase my position size going forward. However, should my perspective change or if I gather additional fundamental data that influences my views, I will provide updates under this post.

Shares of HPQ Fall Sharply after Report → Revenue decreased by 10% to USD 13.2 billion compared to USD 14.65 billion a year ago. This was the third quarter in a row that HP fell short of analysts' estimates.
→ “While we expect another quarter of sequential growth in Q4, the external environment has not improved as quickly as anticipated and we are moderating our expectations as a result,” said HP CEO Enrique Lores.
→ Earnings per share was 86 cents (in line with forecasts), and the company estimates earnings for the next quarter could be between 85 cents and 97 cents.
As a result, at yesterday's low, the fall in the share price of HP Inc. exceeded 10%. Can the fall continue?
An analysis of the HPQ stock chart makes a strong bullish case:
→ HPQ price closed at the high of the day;
→ the price has found support from the lower boundary of the parallel channel;
→ the price fell below the support at 28.90, but closed above. This may mean that the increased volatility and activation of stop-losses located below the obvious support could be used by large players to accumulate long-term long positions at low prices, which were formed for a short period after the fundamental event.
By the way, according to Lores, the availability of artificial intelligence products at the end of 2024 should refresh consumer and commercial sales.
This article represents the opinion of the Companies operating under the FXOpen brand only. It is not to be construed as an offer, solicitation, or recommendation with respect to products and services provided by the Companies operating under the FXOpen brand, nor is it to be considered financial advice.

HPQ Entry, Volume, Target, Stop, ResistanceEntry: when price clears 31.47
Volume: with daily volume greater than 8.49M
Target: 36.00 area
Stop: Depending on your risk tolerance; 29.98 gets you 3/1 Risk/Reward - I would close the trade immediately if proves moves lower after earnings!
Resistance: 35.30-35.75
This swing trade idea is not trade advice and is strictly based on my ideas and technical analysis. No due diligence or fundamental analysis was performed while evaluating this trade idea. Do not take this trade based on my idea, do not follow anyone blindly, do your own analysis and due diligence. I am not a professional trader.

HP Breakout Done Waiting Retest!Hi mates, Sharing weekly chart of HP as we can observe that after making a recent lows of 25 levels price started moving up and continue trading in rising channel and now on the last session of previous week it broke a horizontal resistance (inside the channel) which earlier was a good support so i am expecting after this breakout price will retest it's breakout zone and will get a bounce from there so it will be a buy opportunity there after getting a bounce and after this execution price will probably continue marching up again in channel with following the current trend of higher highs and higher lows for targets i identified some resistances on this provided chart.
KINDLY NOTE-: This is not and trade or investment advice. This publication is meant for only learning purpose.
Regards- Amit

HP Leaping From SupportHi friends, As we can see that Hp is bouncing from rising and horizontal support both and currently price is sustaing above resistance so if it will close above resistance i am planing to go long side trade in it levels are mentioned on chart for this trade.
This is not and trade or investment advice. This idea is meant for learning only.
Best Regards happy trading- Amit

HPQ HP Options Ahead of EarningsIf you haven`t sold HPQ here:
Then analyzing the options chain and the chart patterns of HPQ HP prior to the earnings report this week,
I would consider purchasing the 32usd strike price Calls with
an expiration date of 2024-1-19,
for a premium of approximately $1.72.
If these options prove to be profitable prior to the earnings release, I would sell at least half of them.
Looking forward to read your opinion about it.

Buying HP at trend of higher lows.HP Inc - 30d expiry - We look to Buy at 30.32 (stop at 29.32)
The sequence for trading is higher highs and lows.
Broken out of the triangle formation to the downside.
The trend of higher lows is located at 30.20.
We look to buy dips.
This stock has seen good sales growth.
Our profit targets will be 32.82 and 33.32
Resistance: 31.50 / 32.30 / 33.30
Support: 30.87 / 30.20 / 29.32
Please be advised that the information presented on TradingView is provided to Vantage (‘Vantage Global Limited’, ‘we’) by a third-party provider (‘Everest Fortune Group’). Please be reminded that you are solely responsible for the trading decisions on your account. There is a very high degree of risk involved in trading. Any information and/or content is intended entirely for research, educational and informational purposes only and does not constitute investment or consultation advice or investment strategy. The information is not tailored to the investment needs of any specific person and therefore does not involve a consideration of any of the investment objectives, financial situation or needs of any viewer that may receive it. Kindly also note that past performance is not a reliable indicator of future results. Actual results may differ materially from those anticipated in forward-looking or past performance statements. We assume no liability as to the accuracy or completeness of any of the information and/or content provided herein and the Company cannot be held responsible for any omission, mistake nor for any loss or damage including without limitation to any loss of profit which may arise from reliance on any information supplied by Everest Fortune Group

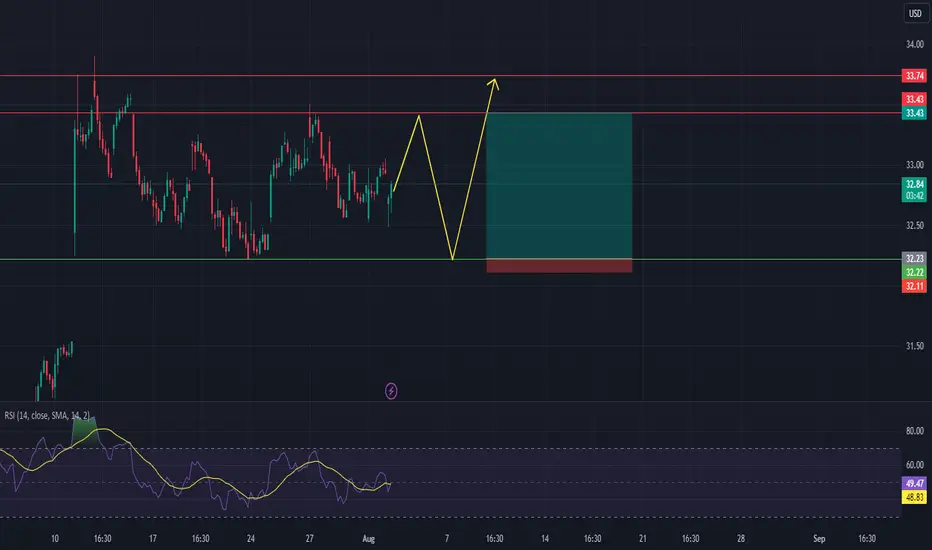
Nice setupPrice is forming a bullish flag above the broken support. Earning call on 08/24. I bought calls $33 exp 08/25. If everything goes well, I'll sell most of my calls before earnings and leave just a few for speculation.

HPQ 1h time frame analysisHi Traders.
Let's take a look at HPQ.
The price remains in the middle of the range.
We expect that the price will rise a little bit higher and then come back down to retest the support again which would be our entry for a long position.
Stop loss should be placed below the support.
We believe that after retesting the support, the price will move towards the resistance level which would be our target for a long position.
Good luck
HPQ BUY Hi, according to my analysis of HPQ stocks, there is a good opportunity to buy. The stock remains positive. With the breach of the bullish gradient pattern, it also broke the strong resistance at level 31, where we notice a strong price gap above the pattern, which is evidence of a strong entry for buyers. good luck for everbody

HP in ascending triangle.HP Inc - 30d expiry - We look to Buy at 29.01 (stop at 27.81)
Price action has formed a bullish ascending triangle formation.
The sequence for trading is higher highs and lows.
Trend line support is located at 28.75.
Support is located at 29.00 and should stem dips to this area.
A lower correction is expected.
28.53 has been pivotal.
Our profit targets will be 32.01 and 32.51
Resistance: 30.87 / 31.71 / 32.00
Support: 30.41 / 30.00 / 29.50
Risk Disclaimer
The trade ideas beyond this page are for informational purposes only and do not constitute investment advice or a solicitation to trade. This information is provided by Signal Centre, a third-party unaffiliated with OANDA, and is intended for general circulation only. OANDA does not guarantee the accuracy of this information and assumes no responsibilities for the information provided by the third party. The information does not take into account the specific investment objectives, financial situation, or particular needs of any particular person. You should take into account your specific investment objectives, financial situation, and particular needs before making a commitment to trade, including seeking advice from an independent financial adviser regarding the suitability of the investment, under a separate engagement, as you deem fit.
You accept that you assume all risks in independently viewing the contents and selecting a chosen strategy.
Where the research is distributed in Singapore to a person who is not an Accredited Investor, Expert Investor or an Institutional Investor, Oanda Asia Pacific Pte Ltd (“OAP“) accepts legal responsibility for the contents of the report to such persons only to the extent required by law. Singapore customers should contact OAP at 6579 8289 for matters arising from, or in connection with, the information/research distributed.

Ascending Triangle on the HPQ Daily ChartSWING IDEA
Looking for a trend continuation formation on NYSE:HPQ . The current chart setup could play out bullish and can be taken advantage of with a swing trade. (14D out $30 CALL) The price has returned to the same relative high 3 times. 1/2 way there on characteristics of an ascending triangle. The lows show an upward trend, indicating the sellers can't raise enough interest to form a new lower low before buyers push up the price. These characteristics form the Ascending Triangle.
The breakout point is when the price closes outside the triangle and PRIMARILY is the signal for most traders. HERE, we operate in assuming the continuation of the trend by attempting to swing an option close to the money.
Focusing on the diagonal trend line shows lows are rising and indicate buyer interest is increasing.

HPQ to find buyers at trend of higher lows?HP Inc - 30d expiry - We look to Buy at 28.36 (stop at 27.16)
Price action has formed a bullish ascending triangle formation.
The sequence for trading is higher highs and lows.
Trend line support is located at 28.30.
Previous resistance at 28.50 now becomes support.
A lower correction is expected. We look to buy dips.
Our profit targets will be 31.36 and 31.86
Resistance: 30.50 / 31.47 / 32.00
Support: 30.00 / 29.20 / 28.30
Please be advised that the information presented on TradingView is provided to Vantage (‘Vantage Global Limited’, ‘we’) by a third-party provider (‘Signal Centre’). Please be reminded that you are solely responsible for the trading decisions on your account. There is a very high degree of risk involved in trading. Any information and/or content is intended entirely for research, educational and informational purposes only and does not constitute investment or consultation advice or investment strategy. The information is not tailored to the investment needs of any specific person and therefore does not involve a consideration of any of the investment objectives, financial situation or needs of any viewer that may receive it. Kindly also note that past performance is not a reliable indicator of future results. Actual results may differ materially from those anticipated in forward-looking or past performance statements. We assume no liability as to the accuracy or completeness of any of the information and/or content provided herein and the Company cannot be held responsible for any omission, mistake nor for any loss or damage including without limitation to any loss of profit which may arise from reliance on any information supplied by Signal Centre.

HPQ Entry, Volume, Target, Stop, ResistanceWhen price clears: 31.47
With daily volume greater than 8.49M
Target: 36.00 area
Stop: Depending on your risk tolerance; 29.98 gets you 3/1 Risk/Reward - I would close the trade immediately if proves moves lower after earnings!
Resistance: 35.30-35.75
This swing trade idea is not trade advice and is strictly based on my ideas and technical analysis. No due diligence or fundamental analysis was performed while evaluating this trade idea. Do not take this trade based on my idea, do not follow anyone blindly, do your own analysis and due diligence. I am not a professional trader.

HPQ - Long Channel A long up channel
I expect the recent low to be met with continuation upwards as this is a very strong channel
Bullish long term

BUY SETUP #HPQ#HPQ on the 4 hour time frame is a probable buy setup.
Look for trend continuation setups, manage your risk and take your profits when they are available before they are taken from you!
Or hold on for the larger degree bullish move

HPQ WCA - Ascending Triangle Company: HP Inc.
Ticker: HPQ
Exchange: NYSE
Sector: Technology
Introduction:
Hello and thank you for taking the time to read my post. Today, we analyze the weekly chart of HP Inc. (HPQ), focusing on an interesting price pattern, an ascending triangle as a reversal pattern. Although rare, ascending triangles can indeed act as reversal patterns, offering potential trading opportunities.
Ascending Triangle Reversal Pattern:
An ascending triangle is a bullish continuation or reversal pattern, characterized by a horizontal resistance line and a rising trendline that connect the higher lows. The pattern typically indicates an accumulation phase where buyers are gaining control, leading to a potential breakout above the horizontal resistance.
Analysis:
On the weekly chart, HPQ exhibits an ascending triangle reversal pattern. We can see a clear horizontal resistance line at $30.95, which has already been touched three times, and a clear diagonal uptrend line that has been touched twice. Importantly, this pattern is forming above the 200 EMA, reflecting a bullish environment.
The price target for this pattern is $37.60, representing a potential gain of approximately 21%. Traders should closely monitor the horizontal resistance level at $30.95 for any signs of a breakout.
Conclusion:
The HPQ weekly chart analysis highlights an ascending triangle reversal pattern, signaling a potential reversal of the current trend. Traders should closely monitor the horizontal resistance level for any signs of a breakout. As always, it's essential to consider risk management and proper position sizing when trading based on chart patterns.
Please note that this analysis is not financial advice. Always do your own due diligence when investing or trading.
If you found this analysis helpful, please like, share, and follow for more updates. Happy trading!
Best regards,
Karim Subhieh

HP in ascending triangle.HP Inc - 30d expiry - We look to Buy at 28.36 (stop at 27.16)
Price action has formed a bullish ascending triangle formation.
The sequence for trading is higher highs and lows.
Trend line support is located at 27.90.
Previous resistance at 28.50 now becomes support.
A lower correction is expected. We look to buy dips.
Our profit targets will be 31.36 and 31.86
Resistance: 30.50 / 31.47 / 32.00
Support: 30.00 / 29.20 / 28.30
Please be advised that the information presented on TradingView is provided to Vantage (‘Vantage Global Limited’, ‘we’) by a third-party provider (‘Signal Centre’). Please be reminded that you are solely responsible for the trading decisions on your account. There is a very high degree of risk involved in trading. Any information and/or content is intended entirely for research, educational and informational purposes only and does not constitute investment or consultation advice or investment strategy. The information is not tailored to the investment needs of any specific person and therefore does not involve a consideration of any of the investment objectives, financial situation or needs of any viewer that may receive it. Kindly also note that past performance is not a reliable indicator of future results. Actual results may differ materially from those anticipated in forward-looking or past performance statements. We assume no liability as to the accuracy or completeness of any of the information and/or content provided herein and the Company cannot be held responsible for any omission, mistake nor for any loss or damage including without limitation to any loss of profit which may arise from reliance on any information supplied by Signal Centre.

Ascending Triangle?? I spotted out in a sending triangle on HP stock. This indicates rather it's going to go up or down depending on the trend of the ascending triangle


HP levels above 31 continue to attract sellers.HP Inc - 30d expiry - We look to Sell at 30.95 (stop at 32.15)
The primary trend remains bearish.
Levels above 31 continue to attract sellers.
Expect trading to remain mixed and volatile.
31.09 has been pivotal.
31.02 has been pivotal.
The trend of lower highs is located at 30.95.
Our profit targets will be 27.95 and 27.35
Resistance: 30.30 / 31.09 / 32.00
Support: 29.12 / 28.30 / 27.50
Please be advised that the information presented on TradingView is provided to Vantage (‘Vantage Global Limited’, ‘we’) by a third-party provider (‘Signal Centre’). Please be reminded that you are solely responsible for the trading decisions on your account. There is a very high degree of risk involved in trading. Any information and/or content is intended entirely for research, educational and informational purposes only and does not constitute investment or consultation advice or investment strategy. The information is not tailored to the investment needs of any specific person and therefore does not involve a consideration of any of the investment objectives, financial situation or needs of any viewer that may receive it. Kindly also note that past performance is not a reliable indicator of future results. Actual results may differ materially from those anticipated in forward-looking or past performance statements. We assume no liability as to the accuracy or completeness of any of the information and/or content provided herein and the Company cannot be held responsible for any omission, mistake nor for any loss or damage including without limitation to any loss of profit which may arise from reliance on any information supplied by Signal Centre.

HP Will surprise you in q1This is not a financial advice, but rather an open opinion and trend analysis, mixed with market speculation based on size, operating margin, and results driven game
