Shorting IBM on weak fundamentals and appropriate wave structureYesterday the company published a mixed earnings report. It reported:
* earnings per share of $3.84 versus expected $3.78; that's a beat.
* revenue of $20.8 billion versus $20.95 billion, that's a miss, and the 13th consecutive quarterly decline.
The stock lost nearly 5% in the after hours. We are expecting more downside, as the wave count suggests the continuation of a longer-term downtrend. Stop-loss is a daily close above 170.
IBM trade ideas

IBM Ready For A BreakoutIBM had a disastrous quarter in Q3 2014, where growth dramatically slowed. The market has punished IBM by selling it off hard. Following its drop from $190 to $160 IBM went into a long period of accumulation. The chart reminds me a classic Wyckoff pattern. As Richard Wyckoff explained in his seminal book on tap reading, large Wallstreet operators are not afraid to buy a fallen stock, provided the stock is large, liquid and has good earnings. In fact, they welcome an opportunity to accumulate shares at discount prices confident in their ability to mark up the stock once they have built a full position. While Wyckoff's work cover the classic period of 1920-30, I think its core is as relevant today as it once was.
IBM fits the profile perfectly. It is an institutional stock that mutual fund managers are extremely comfortable with. Therefore, it is reasonable to assume that large operators are accumulating the stock. The chart, in general, seems to confirm. You can see a typical pattern of the stock being stuck in a ~ 8% range with a very strong support in $152 area. The support has been tested 3 times so far and held up. Finally, on April 23 IBM broke out of the range on increased volume. This is a sign that accumulation is over and the large operators are ready to mark up the stock.
optionsforum.net

Warren Buffett IBM train taking offIBM is the third highest valued holding of Berkshire Hathaway. Mega accumulation in strong hands. From what seen in his other holdings, he treats his stock well.
Careful of investing on blind speculation, and have some of your own TA to back it up. But from what I see, the last dip was swallowed, so that price range would be an ideal area to enter at low risk if we get a retrace.
Enjoy


IBM: Hoping For Long Out Of Very Strong ResistanceExpecting a nice move out of IBM soon. The resistance is very strong, and once broken we could see a strong move as a decision has finally been made.
We had a nice bullish kicker yesterday trading day. Whilst the days trading before that supported on the 50EMA. Creating a morning star/kicker signal at this level.
Waiting to see strong buying before I enter this trade.

IBM Gap up on monday? I have recently being reading a lot of about institutional buying and selling. And this looks like a perfect accumulation phase from the institutions

IBM Gap up on Monday?Based on recent material I have read about institutional buying and selling this looks like a perfect accumulation phase. Notes are on the chart :)

Countdown to the Q12015 earnings report.Expecting a result of the earnings report to force this stock to move outside of this range, with the H&S pattern confirming that a Long trade may present itself with a potential good R:R

Last week's Elite Zone winner struggles with resistance$IBM was one of our winners, in the Elite Zone last week with an impressive breakout of a descending trading channel we've been monitoring. Now, when it is at the top of my buying zone, the question is, can $IBM make it above 165$ to continue to my secondary target level - The 200 SMA line?
It all started with a bullish AB=CD pattern on the weekly 61.8 Fib level.. so the potential is there. Will we see another retracement lower, before the next rally?
Bullish longer term, cautious short term

IBM $164.52: Confirms a higher base on rallying through FebruaryIBM rebounded off the 153.40 low (March 13, 2015) through February’s 162.49 high to confirm a higher base over the former and trigger further strength towards 165.59 (October 31, 2014 range high) ahead of last October’s 170.33 gap low (October 20, 2014 high) near the 200 day moving average currently at 169.53. 160.35/158.81 (March 20/19, 2015 lows) serves as the immediate support zone where buyers are expected to step in.

Keep knocking on the door and it'll eventually break.Been watching this level since the start of the year, it seems that bulls refuse to give up IBM.
Knocking on the resistance of $164 again and again over the past few months. Eventually, bears behind the door might give way.
Open: 164.69
S/L: 162.01
T/P: 178.07 (gaps)
Earnings might be the catalyst, I've my algorithmic orders waiting.

$IBM$IBM [ nice bull flag. It was a while IBM give us such nice and clear set ups. Double stochasics set up on 1 H and Daily charts


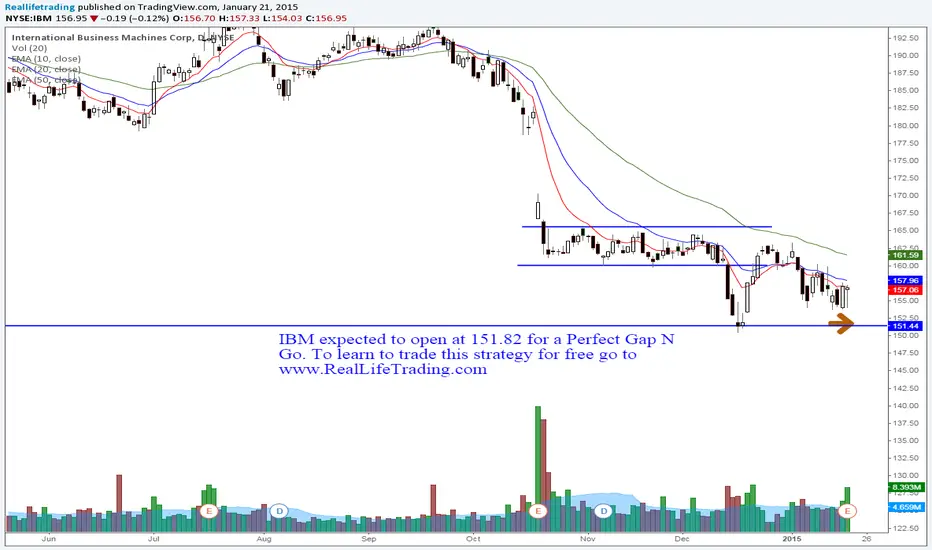
IBM Perfect Gap N Go (Brad Reed Jan21,2015) Try #2IBM expected to open at 151.82 for a Perfect Gap N Go. To learn to trade this strategy for free go to www.RealLifeTrading.com
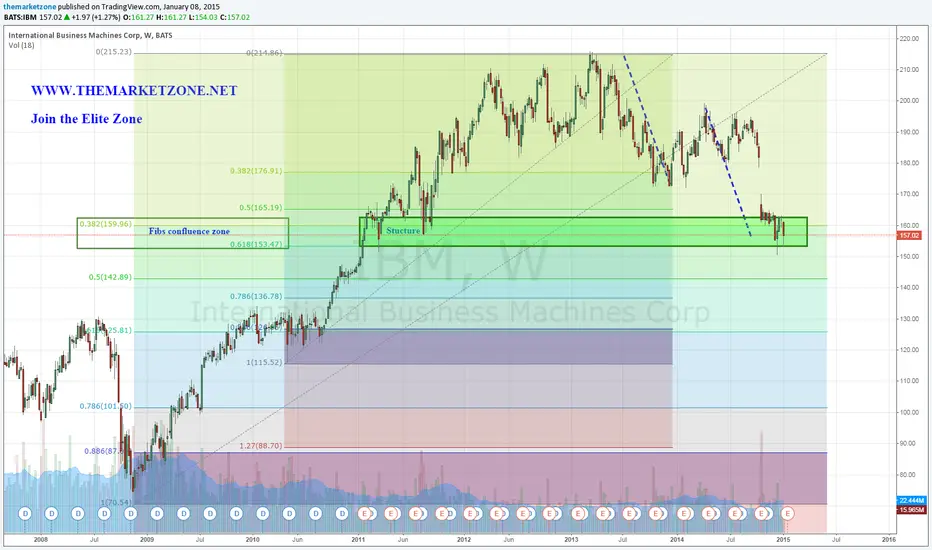
This Zone should hold for the stock to start its pullback180$ is an interesting target level for an upside pullback. In order to do so, $IBM must hold the current support zone which includes both structure and Fibs confluence support elements.
The weekly AB=CD pattern was the trigger for my entry

IBM, from long to shortMy long entry at 160 & 161 were unsuccessful. Price turned against me
haha caught with my pants down
Make some losses and so quickly turned short at 159.70 and immediately turn short, next quick target around 153.70
RSi trendline was broken, but overall bullish divergence still in play until signal break below prior RSI low.

I expect to see a double bottom.I don't believe in a rise that occurs outside of the B Bands. Therefore, we must give them time to turn around.

IBM's well oiled wheel could be about to drop off. Just read this article on www.marketwatch.com
"IBM
• Sector: technology
• Market value: $160 billion
• 2014 return: -13%
While most large caps have risen from October’s slide, IBM has been left behind. That means a great buying opportunity for long-term investors.
IBM is one of those mega-cap tech stocks that have a place in almost every portfolio. For starters, there’s the 2.7% dividend yield and a history of payouts since 1916. There’s also the stability that comes with a company that does roughly $100 billion in annual sales and sports over $14 billion in cash and investments on its balance sheet."
Source full article : www.marketwatch.com
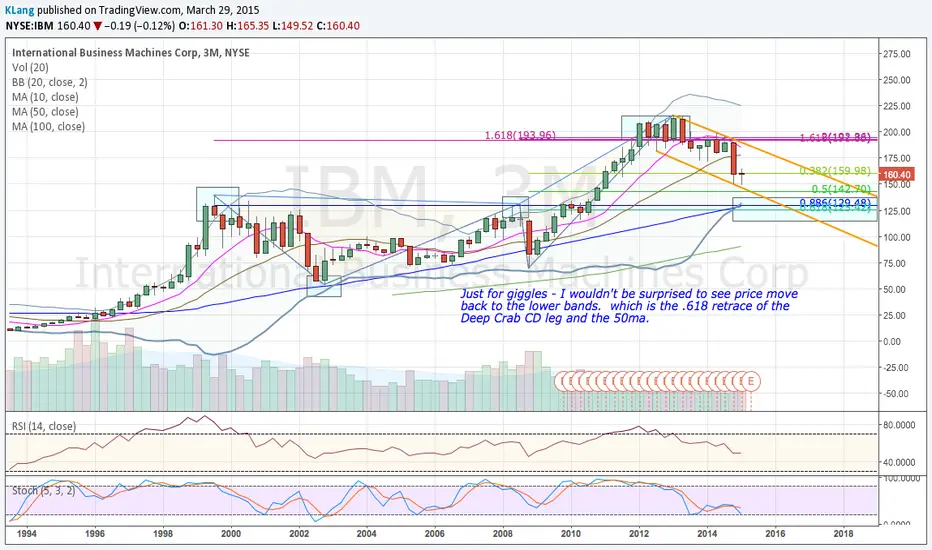
One could dig real deep and find all sorts of justifiable reasons why such reputable company should continue it's upward price trajectory in to indefinite future.
However, from the price history on this chart, I suspect that we have just completed a 5 wave cycle that could be also a larger 5 wave cycle that began from bottom of 1929-1932 Wall Street crash. See the chart of Dow as surrogate for the sector.
Even ignoring the price history before 1980, having completed 5 wave cycle, EW guidelines suggest price correcting to wave 4 low of one cycle degree lower. That suggest a ball park figure in the region of $70-50 area.
Is it the right time to buy this stock or many others like it. I think not. Rather wait for few more year and pick it up at bargain basement price may be $50 or lower.
Or better still consider long term far out of the money PUT Options and sit back.
As always do you own analysis. Select to follow me and the chart for any future updates or new charts. Share it freely with others you feel might benefit from this chart.
If you have specific alternative view and chart to share please feel fee to do so.

IBM, short term longUpon releasing the bad earning results, IBM gap down and followed through to channel bottom as can be seen from the massive volume. I considered this as climatic selling.
Price move upward and got rejected by 8ema again and touching channel bottom again on Thursday.
Both long at 161, then 160 were triggered, the short-term target is 172.4

Downtrend for IBM crystallizesIBM just reported less than expected earning, price manage to find its way to current downtrend channel bottom.
I see a support around 157. So i gotta be patient first.
