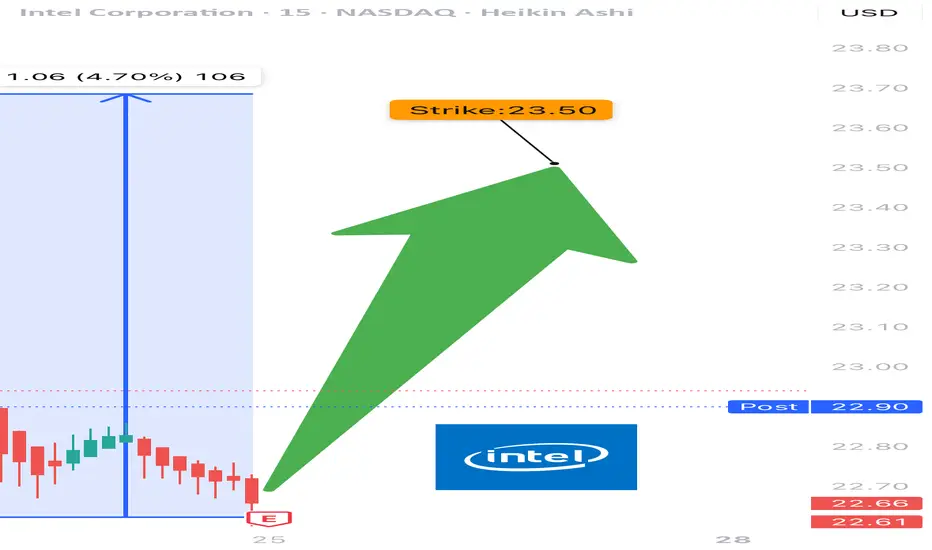
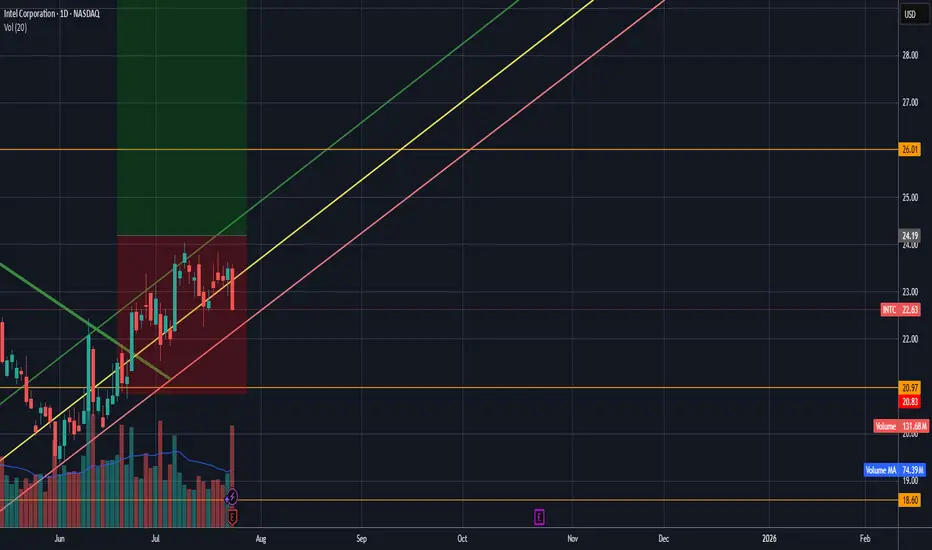
Bullish?Anyone have any thoughts? Im thinking 9/19 24C. Its looking primed and I just saw the short squeeze news, not that it could really mean anything, but what do yall think?
Next report date
—
Report period
—
EPS estimate
—
Revenue estimate
—
−89.34 MXN
−391.05 B MXN
1.11 T MXN
4.37 B
About Intel Corporation
Sector
Industry
CEO
Lip-Bu Tan
Website
Headquarters
Santa Clara
Founded
1968
FIGI
BBG000HVM0G0
Intel Corporation engages in the design, manufacture, and sale of computer products and technologies. It delivers computer, networking, data storage, and communications platforms. The firm operates through the following segments: Client Computing Group (CCG), Data Center Group (DCG), Internet of Things Group (IOTG), Non-Volatile Memory Solutions Group (NSG), Programmable Solutions (PSG), and All Other. The CCG segment consists of platforms designed for notebooks, 2-in-1 systems, desktops, tablets, phones, wireless and wired connectivity products, and mobile communication components. The DCG segment includes workload-optimized platforms and related products designed for enterprise, cloud, and communication infrastructure market. The IOTG segment offers compute solutions for targeted verticals and embedded applications for the retail, manufacturing, health care, energy, automotive, and government market segments. The NSG segment constitutes of NAND flash memory products primarily used in solid-state drives. The PSG segment contains programmable semiconductors and related products for a broad range of markets, including communications, data center, industrial, military, and automotive. The All Other segment consists of results from other non-reportable segment and corporate-related charges. The company was founded by Robert Norton Noyce and Gordon Earle Moore on July 18, 1968 and is headquartered in Santa Clara, CA.
Related stocks

INTC EARNINGS TRADE (07/24)
🚨 INTC EARNINGS TRADE (07/24) 🚨
🎧 Earnings drop after close — here’s the high-conviction setup 📊
🧠 Key Highlights:
• 💥 Surprise Beat Rate: 88%, avg surprise = 419%
• 📉 Margins: Ugly (-36% net margin) but improving sentiment
• 📈 Volume Surge + $24 resistance test = pre-earnings drift 🚀
• 🔎 Mixed op
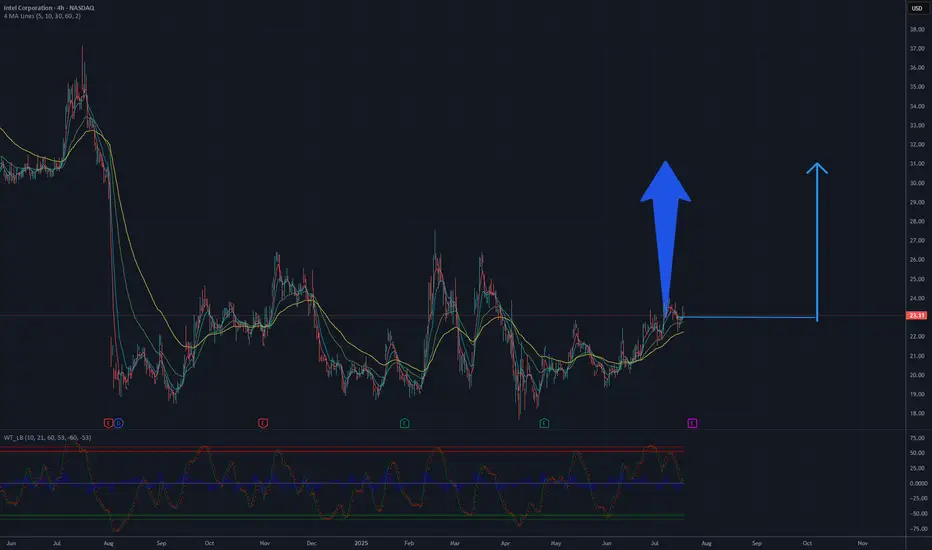
Is it a time for INTEL? 32 $ will be soon.The Intel Corporation (INTC) chart on NASDAQ illustrates the stock price dynamics from 2024 to July 2025. Initially, the price rose to a peak in the first half of 2024, followed by a significant decline, reaching its lowest point around 24 USD by the end of 2024. Since then, the price has been conso
Intel to 40. A bet on America's chip when the chips are downIntel is an interesting stock. I made a bet on it this week. It’s very cheap trading at book value. Lots of bad news has destroyed this stock while other chip stocks are at all time highs. With a new CEO running the show and investing in next gen chip production, I think he turns it around.
I think

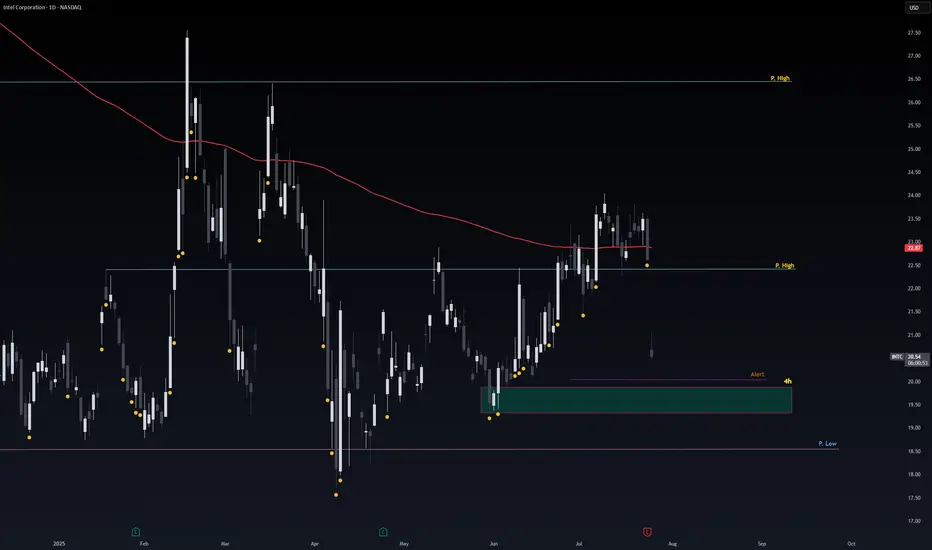
Safe Entry IntelThe 4h Green Zone is Safe & Strong Support for Intel.
If not respected the Pink Line is Second Strong support level.
Note: 1- Potentional of Strong Buying Zone:
We have two scenarios must happen at The Mentioned Zone:
Scenarios One: strong buying volume with reversal Candle.
Scenarios Two: Fake
$INTC Got Smacked. Relief Bounce or Trap?Yikes. NASDAQ:INTC just faceplanted from $23.50 straight down to $20.50. It’s peeking its head up now. If you’re playing the bounce, be nimble — this thing’s still bleeding on the higher timeframes. Don't get in unless you see more pickup and buy signal.
UltraAlgo caught the drop early. If it cr

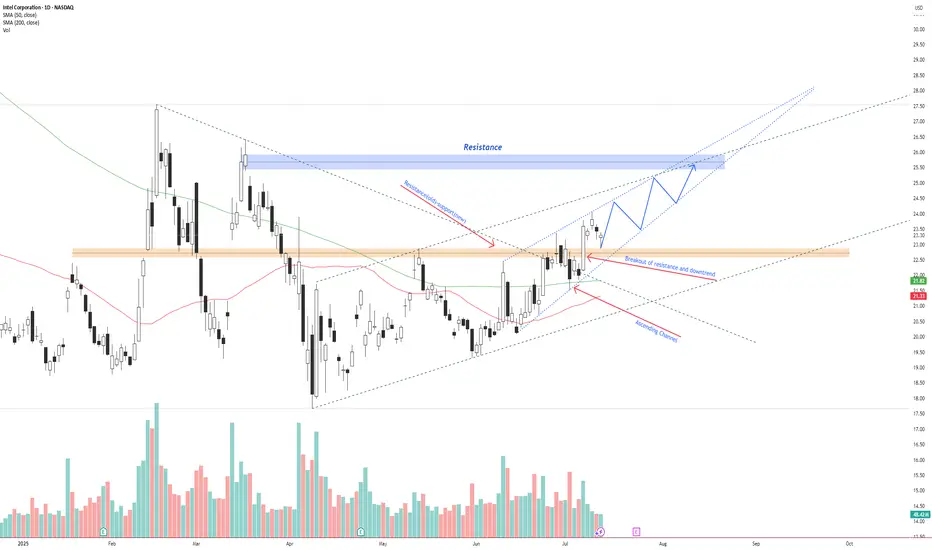
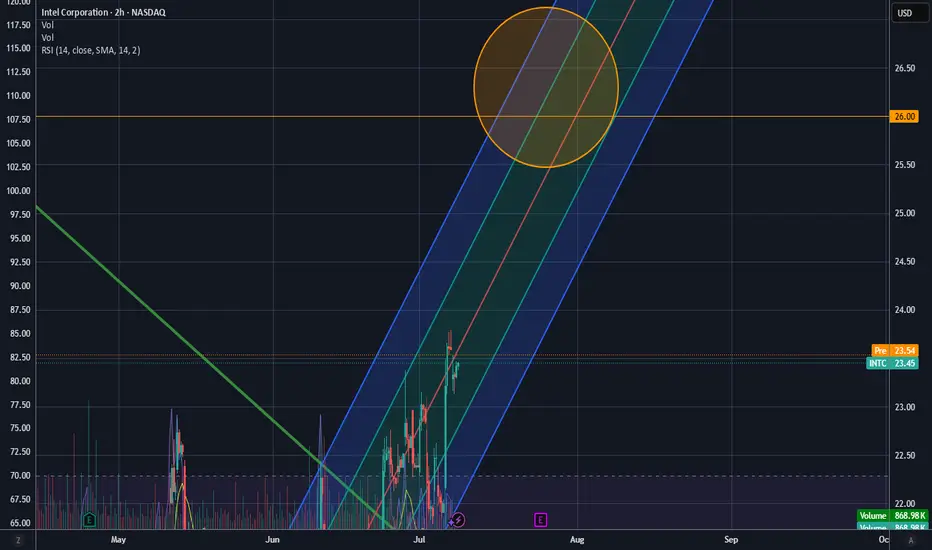
INTC – Breakout Confirmed, Bullish Continuation Inside AscendingIntel NASDAQ:INTC has broken above previous resistance and a descending trendline, confirming a bullish reversal.
Price is currently respecting an ascending channel and forming higher highs and higher lows. The breakout retest around $22.50 has held as new support.
If the current structure rem
Intel Failed to Get Above the 0.382When the CEO says he is cost cutting across the whole board, but discloses no plan for growth you get the pullback.
Made a LH on the weekly, but the daily still has a HL.
If it fails here, we could see $18 dollars or lower.
Falling Wedge Pattern is still valid.

To Frustration and Beyond! Welp... That Was That. And I Guess I Was Wrong.
(For now.)
Bears gonna bear, bulls gonna bull, and Intel’s still out here quietly building the Death Star while everyone’s chasing squirrel stocks hitting all-time highs. Yeah, we’re not mooning yet, but I still believe INTC will outpace most of the m
I could be wrong.... but: Earnings breakout? Intel has certainly tested the patience of investors lately. That said, it’s in these moments — when sentiment turns and many walk away — that opportunity quietly builds. I’m maintaining my position, currently averaging around $24 per share alongside a sizable options exposure.
What makes this cycl
See all ideas
Summarizing what the indicators are suggesting.
Neutral
SellBuy
Strong sellStrong buy
Strong sellSellNeutralBuyStrong buy
Neutral
SellBuy
Strong sellStrong buy
Strong sellSellNeutralBuyStrong buy
Neutral
SellBuy
Strong sellStrong buy
Strong sellSellNeutralBuyStrong buy
An aggregate view of professional's ratings.
Neutral
SellBuy
Strong sellStrong buy
Strong sellSellNeutralBuyStrong buy
Neutral
SellBuy
Strong sellStrong buy
Strong sellSellNeutralBuyStrong buy
Neutral
SellBuy
Strong sellStrong buy
Strong sellSellNeutralBuyStrong buy
Displays a symbol's price movements over previous years to identify recurring trends.
US458140BK5
INTEL 20/60Yield to maturity
8.24%
Maturity date
Feb 15, 2060
US458140BX7
INTEL 21/61Yield to maturity
8.18%
Maturity date
Aug 12, 2061
US458140BW9
INTEL 21/51Yield to maturity
8.09%
Maturity date
Aug 12, 2051
INTC4914060
Intel Corporation 3.25% 15-NOV-2049Yield to maturity
7.79%
Maturity date
Nov 15, 2049
US458140BV1
INTEL 21/41Yield to maturity
7.52%
Maturity date
Aug 12, 2041
US458140AY6
INTEL CORP. 17/47Yield to maturity
7.41%
Maturity date
May 11, 2047
US458140AV2
INTEL CORP. 16/46Yield to maturity
7.39%
Maturity date
May 19, 2046
INTC4633368
Intel Corporation 3.734% 08-DEC-2047Yield to maturity
7.35%
Maturity date
Dec 8, 2047
INTC5456467
Intel Corporation 5.05% 05-AUG-2062Yield to maturity
7.06%
Maturity date
Aug 5, 2062
INTC4969550
Intel Corporation 4.95% 25-MAR-2060Yield to maturity
7.03%
Maturity date
Mar 25, 2060
US458140AP5
INTEL CORP. 12/42Yield to maturity
7.02%
Maturity date
Dec 15, 2042
See all INTC bonds
Curated watchlists where INTC is featured.


Frequently Asked Questions
The current price of INTC is 384.30 MXN — it has decreased by −8.47% in the past 24 hours. Watch INTEL CORP stock price performance more closely on the chart.
Depending on the exchange, the stock ticker may vary. For instance, on BMV exchange INTEL CORP stocks are traded under the ticker INTC.
INTC stock has fallen by −12.07% compared to the previous week, the month change is a −9.98% fall, over the last year INTEL CORP has showed a −33.05% decrease.
We've gathered analysts' opinions on INTEL CORP future price: according to them, INTC price has a max estimate of 519.67 MXN and a min estimate of 259.84 MXN. Watch INTC chart and read a more detailed INTEL CORP stock forecast: see what analysts think of INTEL CORP and suggest that you do with its stocks.
INTC reached its all-time high on May 6, 2020 with the price of 1,556.00 MXN, and its all-time low was 167.50 MXN and was reached on Nov 21, 2008. View more price dynamics on INTC chart.
See other stocks reaching their highest and lowest prices.
See other stocks reaching their highest and lowest prices.
INTC stock is 10.93% volatile and has beta coefficient of 1.61. Track INTEL CORP stock price on the chart and check out the list of the most volatile stocks — is INTEL CORP there?
Today INTEL CORP has the market capitalization of 1.68 T, it has decreased by −4.24% over the last week.
Yes, you can track INTEL CORP financials in yearly and quarterly reports right on TradingView.
INTEL CORP is going to release the next earnings report on Oct 23, 2025. Keep track of upcoming events with our Earnings Calendar.
INTC earnings for the last quarter are −1.88 MXN per share, whereas the estimation was 0.23 MXN resulting in a −929.12% surprise. The estimated earnings for the next quarter are 0.28 MXN per share. See more details about INTEL CORP earnings.
INTEL CORP revenue for the last quarter amounts to 241.21 B MXN, despite the estimated figure of 224.81 B MXN. In the next quarter, revenue is expected to reach 242.76 B MXN.
INTC net income for the last quarter is −54.74 B MXN, while the quarter before that showed −16.82 B MXN of net income which accounts for −225.43% change. Track more INTEL CORP financial stats to get the full picture.
Yes, INTC dividends are paid quarterly. The last dividend per share was 2.41 MXN. As of today, Dividend Yield (TTM)% is 2.42%. Tracking INTEL CORP dividends might help you take more informed decisions.
As of Jul 27, 2025, the company has 108.9 K employees. See our rating of the largest employees — is INTEL CORP on this list?
EBITDA measures a company's operating performance, its growth signifies an improvement in the efficiency of a company. INTEL CORP EBITDA is 141.61 B MXN, and current EBITDA margin is 12.56%. See more stats in INTEL CORP financial statements.
Like other stocks, INTC shares are traded on stock exchanges, e.g. Nasdaq, Nyse, Euronext, and the easiest way to buy them is through an online stock broker. To do this, you need to open an account and follow a broker's procedures, then start trading. You can trade INTEL CORP stock right from TradingView charts — choose your broker and connect to your account.
Investing in stocks requires a comprehensive research: you should carefully study all the available data, e.g. company's financials, related news, and its technical analysis. So INTEL CORP technincal analysis shows the strong sell today, and its 1 week rating is sell. Since market conditions are prone to changes, it's worth looking a bit further into the future — according to the 1 month rating INTEL CORP stock shows the strong sell signal. See more of INTEL CORP technicals for a more comprehensive analysis.
If you're still not sure, try looking for inspiration in our curated watchlists.
If you're still not sure, try looking for inspiration in our curated watchlists.