Gartner IT Buy Signal I see Gartner provides opportunity and buy option. I will watch today and it seems it is really potential. Will post my analysis in detail.
IT trade ideas

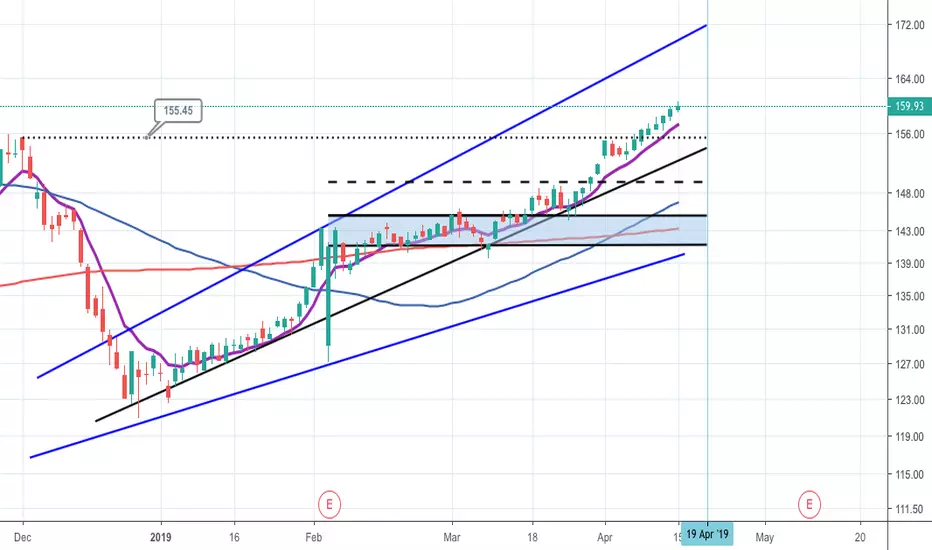
IT - 3 months ASCENDING TRIANGLE══════════════════════════════
Since 2014, my markets approach is to spot
trading opportunities based solely on the
development of
CLASSICAL CHART PATTERNS
🤝Let’s learn and grow together 🤝
══════════════════════════════
Hello Traders ✌
After a careful consideration I came to the conclusion that:
- it is crucial to be quick in alerting you with all the opportunities I spot and often I don't post a good pattern because I don't have the opportunity to write down a proper didactical comment;
- since my parameters to identify a Classical Pattern and its scenario are very well defined, many of my comments were and would be redundant;
- the information that I think is important is very simple and can easily be understood just by looking at charts;
For these reasons and hoping to give you a better help, I decided to write comments only when something very specific or interesting shows up, otherwise all the information is shown on the chart.
Thank you all for your support
🔎🔎🔎 ALWAYS REMEMBER
"A pattern IS NOT a Pattern until the breakout is completed. Before that moment it is just a bunch of colorful candlesticks on a chart of your watchlist"
═════════════════════════════
⚠ DISCLAIMER ⚠
The content is The Art Of Charting's personal opinion and it is posted purely for educational purpose and therefore it must not be taken as a direct or indirect investing recommendations or advices. Any action taken upon these information is at your own risk.

IT short termIT looks interesting.
The price just retested the resistance range so it´s perfect time to enter the short position.
Our estimated target is 325.13 $.
Good luck!


IT - Double Top IdeaIT is experiencing a double top. A higher high is present which might affect the double top but we will just ignore that for now Expect downward move as per the bearish pattern

$IT with a Bullish outlook following its earnings #Stocks The PEAD projected a Bullish outlook for $IT after a Positive Under reaction following its earnings release placing the stock in drift A with an expected accuracy of 85.71%.

Double top on IT?After super hyper parabolic run, this move up looks exhausted and might place potential double top.

$IT with a Bullish outlook following its earnings #Stocks The PEAD projected a Bullish outlook for $IT after a Positive Under reaction following its earnings release placing the stock in drift A with an expected accuracy of 83.33%.

$IT with a Bearish outlook following its earnings #Stocks The PEAD projected a Bearish outlook for $IT after a Negative under reaction following its earnings release placing the stock in drift D with an expected accuracy of 75%.

How To: Combine Technicals & Fundamentals To Find Great StocksWith the markets taking a bit of a battering, I thought I'd show you some more of TradingViews advanced tools to perhaps help you find better quality stocks that might be more resilient to these corrections by combining both Technical Analysis indicators along with some really easy to understand at a glance Fundamental Analysis metrics.
In this video I will cover:
1. How to use the TradingView Screener to find good stocks which didn't pull back much or even went up against the overall market pull back.
2. How to use Moving Averages to find stocks with lower volatility that might be better for buy and hold type investors.
3. How to use the TradingView Income Statement summary tool to quickly identify and help shortlist stocks with better overall fundamentals.
4. How to see using the TradingView Post Market data which stocks are already being bought back into AFTER the market has closed.
5. How to flag the ones you like and then save them into a TradingView Watchlist you can then review later.
6. How to save your TradingView Screener set up, and have any new stocks matching your criteria to be automatically emailed to you.

GARTNER Idea DailyHey my friends, GARTNER is in a bullish movement with a strong buying volume traded and a water-carrying candle followed by a more marked trace at the buyer's level. In TIMEFRAME M1 we see an upside down short leg hammer candle with a large emitted sell volume, it is heading towards its last previous lower. Doing her swallow she will test the top of the stabilization zone again.
Great possibility of breaking out the price with the momentum of both the zone to reach the second and start on the next high. With an attempt to fill a bearish breakout gap may be a failure in the session. Little force to test half of the intermediate median of ANDREWS PITCHFORK.
Please LIKE & FOLLOW, thank you!

Stock IT SeasonalityStock IT seasonality starts to Buy date on February 24 and ends Sell date on May 1
Percent Profitable is 89.47% in 19 years and an average return of 8.33% per year

IT watch for support test on bearish market this upcoming weekA Bearish market this week likely means IT will test it's recent support at 152. Coincidentally this is also the 200sma. I will be looking at 145/150 puts on a break and or a retest of support. Thanks for looking happy trading!

DailyPlenty of warning on this one, 3 gaps up and then a bearish dark cloud cover. For once I listened and got out with a nice profit.