IWM trade ideas

Rolling (IRA): IWM April 21st 174 to Aug 21st 161 Short Put... for a 1.71 credit.
Comments: Kicking this can down the road so that I can be out of April. Total credits collected of 2.45 (See Post Below) plus the 1.71 here for a total of 4.16.

IWM a good indicator for market direction going down . small capinteresting enough the Russell 2000 is said to be a good indicator where the market can go in the next few weeks . already broke that ascending wedge. I believe it can go and test the 52 week lows of 162.

Put to Call Ratio Correlation IndicatorOverview of the put to call ratio correlation indicator I released over the weekend.
It is linked below.
Its best to review the indicator description prior to watching the video to get an idea of how it works.
This video goes over the practical application of the indicator in trading.
Let me know your questions/comments below.
Safe trades everyone!

I don't like thisToo many bear patterns, the only thing that is preventing the price to crash is the strong trendline. I'm not sure if is going to hold, I have a short position but I will close it out at the bottom of the bear flag. In this market I prefer to wait until the support is broken.

We've only just begun IWMIWM, so which percentage down will it wind up being? 86% perhaps? So many waves, so many trend lines which are "right on", and amazing actually, how accurate and right on they are over such a time period.

IWM/SPY 3Y LOW. Is it time for IWM to wake upIs it time for IWM to outperform SPY ? it has been at this level only in 2003 and 2020.

Growth Prospects? - Much work to doInvestors may benefit from keeping an eye on this relationship of IWM to Gold. Small caps, represented by the the Russell 2000 index ( AMEX:IWM ), are generally well-regarded and in favor when growth prospects are good; gold on the other hand is typically considered a defensive store of value. I consider that early 2018 period, when things were generally clicking pretty well in markets, to be a very "key" level and one well worth monitoring. A confirming bullish trigger would be seeing this IWM/Gold relationship break out of the present downward channel, and getting back to and through that key level. Until then, when assessing risk / reward in this 'whipsaw' environment, investors may be better served by exercising continued caution and selectively.

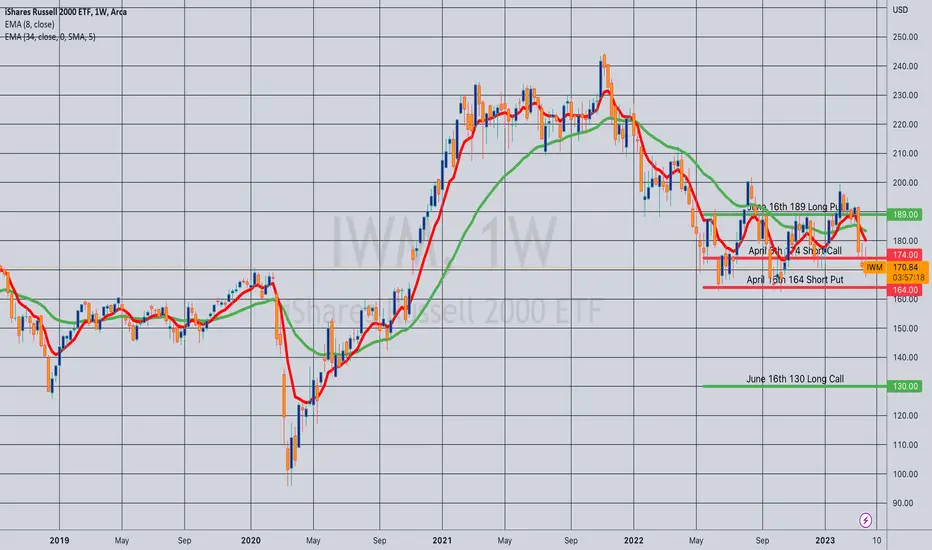
Opening (Margin): IWM April 6th/June 16th Double Die... for a 57.79 debit.
Comments: Doing something a little funky here -- a double diagonal.
The best way to look at this setup is by breaking it down into two aspects: (a) a long call diagonal, with the back month at the +90 delta strike, the front at the -30; and (b) a long put diagonal, with the back month at the -90 delta strike, the front at the -30.
I tend to manage each aspect separately, taking profit on the winning side, while simultaneously looking to reduce cost basis on the losing one, so it's important to know where my break evens are for a given side.
Long call diagonal aspect:
39.42 cost basis, 169.42 break even, 44 wide.
Long put diagonal aspect:
18.37 cost basis, 170.63 break even, 25 wide.
RUSSELL 2000 ETF Stock Chart Fibonacci Analysis 041623 Trading Idea
1) Find a FIBO slingshot
2) Check FIBO 61.80% level
3) Entry Point > 177/61.80%

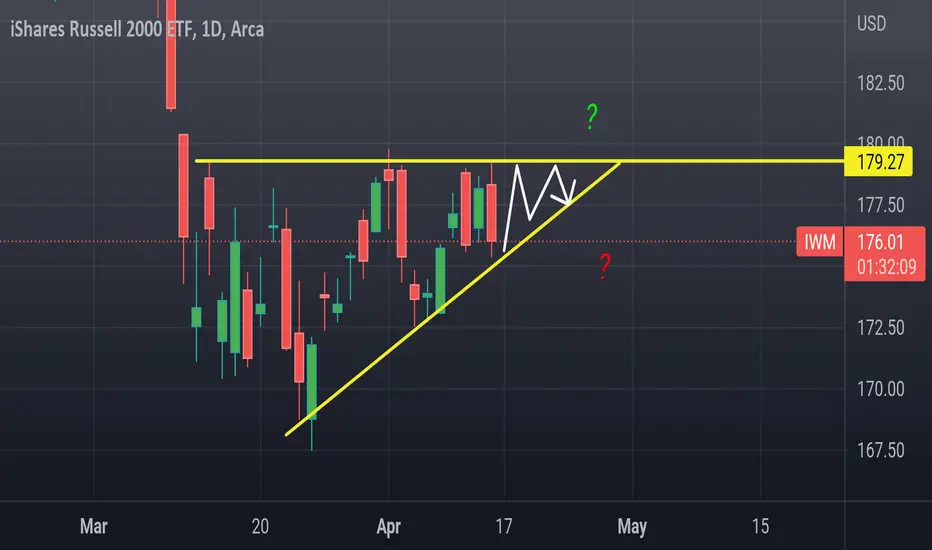
IWM , two paths Getting tight in here,
This could turn out to be a major upside or downside move .. should choose a direction next week.
Inside this triangle I'm neutral, Daily support will be come higher because of rising trendline.. resistance is 180
Opening (IRA): IWM April/May 176/169 Short Put LadderComments:
Starting to deploy at intervals into second quarter expiries, targeting the <16 delta strike paying around 1% of the strike price in credit. I'd prefer weakness and higher IV, naturally, but am not getting it in the short term.
Received a 1.79 credit for the April 21st 176; a 1.75 credit for the May 19th 169.

Opening (IRA): IWM April/May/June 166/160/150 Short Put LadderComments:
Adding rungs in second quarter expiries here, targeting the <16 delta strike paying around 1% of the strike price in credit.
April 21st 166 for a 1.68 credit.
May 19th 160 for a 1.77 credit.
June 16th 150 for a 1.45 credit.

$IWM - Looking interesting between $164.00 and $169.00 #IWM usually bounces from $164.00 to $169.00 area. I am a buyer around that area. #Russell2000
Not an investment advice.

Inverse Head & Shoulders: Right Shoulder FormingNice bounce off the volume shelf the last two days with the right shoulder of the inverse head and shoulders forming and the price gap that fills above at $181.28 and the swing high anchored VWAP right around $180.50.

Echos chartEchos indicators.
Built on Luxalgo indicators. This combination of indicators has been helpful to me in "scalping" the intraday futures market.

IWM: 170-172 Soft?Short idea.
Since the beginning of 2023, IWM has put in a lower low on the daily indicating that support at 170-172 is soft, and the trend of higher lows established by the Oct swing low seems to be broken. Tough April so far -- currently trading below the 20D / 50D / 200D.
The distribution that price is trading in right now is support, but I think 170-172 gets softer with every test.
Short targets: 175 / 176
Profit targets: 172 / 170 / 168 / 163
Trade invalidated > 178

IWM
Over 174.50 and the target is 181 gap close
Below 172.50 and it's a head and shoulder to 167
Technicals don't look as bad as QQQ or SPY..
I would have to say IWM look neutral or bullish.

IWM: Russell 2000 ETF-Elliot Wave PathAMEX:IWM
IWM, The Russell 2000 in the middle of an ABC Zig-Zag Corrective Wave Sequence.
This Zig-Zag is retracing the upmove from the '03 low to '21 high.
As it stands now, the "A" wave has completed 5 waves down, and "B" wave flat looks to be complete.
This suggests that we are already in or about to enter the final 5 waves down for Wave "C".
Looking at a few other indicators, I'm expecting that this "C" Wave will extend 100% of the "A" wave's length.
This would take IWM to the 117 USD area.
On an Elliot-Basis, the correction should terminate somewhere within the larger degree Wave 4, and this 117 USD level is right in the middle of it.
The 117 USD level is also right in between the '18 and Covid lows, and is also in line with my non-EW Median Line target, and bear flag target. (screenshots below)
Short it.
Fat_Fat

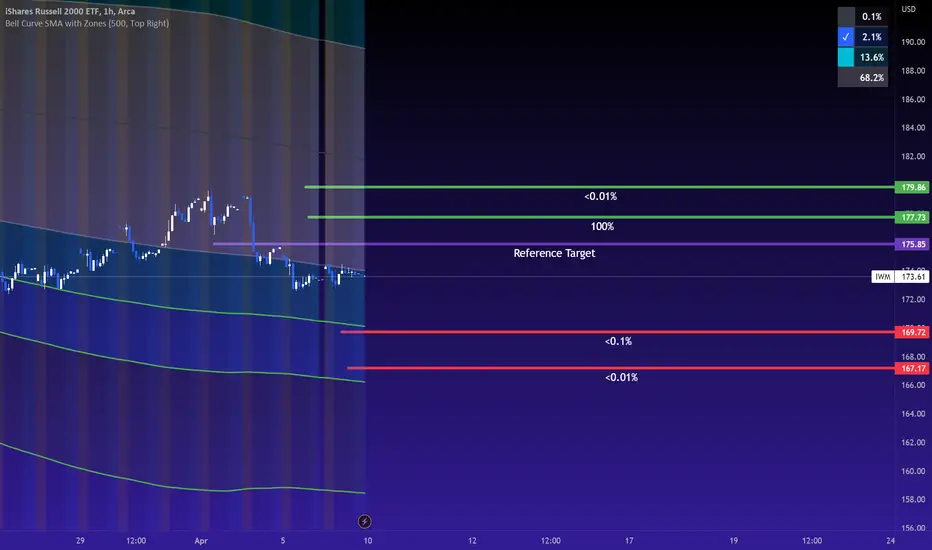
IWM: Week of April 10Projections are bullish for IWM.
We also have a fairly bullish reference target at 175.85.
This also makes sense because we are pushing the low 13% probability range on the 1 hour chart.
The high probability targets for next week are:
176.19 and 172.56.
The highest probability target is 176.19. This would be my initial target on an IWM play next week. The ideal setup would be a gap down of course, so let's see what we are given on Monday.
Otherwise, those are my thoughts and the official targets are in the chart above.
Will do a real time update on Monday.
Safe trades everyone!
Smalls B4 MegasIn both 08 crisis & pandemic crash, small caps consistently going up for several months were the proof that the bears were done.
That has not happened yet for this recession! Notice small caps are at best going sideways, & starting to trend further down, while ^RU50 Mega caps (like XLG) think the worst is behind them & Bulls saying don't miss the party.
But it's not the end of the Bear market. If Main street is still struggling, & we know & see it is all around us, then Wall street is just having a minor rally that will smack them back to reality soon enough.
Momentum doesn't lie, so watch the Volume & trends!

Retest 210?There is a high chance it could retest 210 in May. Volume is high recently. It should stay above 180 for it to happen.

SPY/DIA/IWM/BRK/VIX: AnalysisWeekly analysis for SPY, DIA, IWM, BRK and VIX.
My thoughts, not advice.
Let me know your questions below and safe trades everyone!
