IWM trade ideas

Small caps need to lead in order to confirm the bottomThe small caps are a great barometer of the overall investors' risk appetite. Yesterday's reversal is the first bullish sign. A session above yesterday's high and its 8EMA around $178.5 would confirm the trend change.

I hope everyone is making good money on the crashing marketsThe markets are crashing and I predicted this like so many others 6-9 months ago. We finally reached the edge of the Bear Market. The Ape Army disappeared and lost all their gains. Congratulations, Going to the moon Bro! I stick with IWM the Russel 2000. Target 150 or even 120 by end of year. Inflation will eat the economy and selling assets by the FEDs will bring bond price down, yield up and the stock market will follow. USD will gain value since imports will increase. China at the bring of a collapse as well.
Buying Puts in the IWM for now the way to go, or selling Call Credit Spreads. 50% of the IWM underlaying companies cannot serve their loans. IWM will fall first and deep, Then the NASDAQ, QQQ. Then SPY. Where is the Ape Army??

Head and ShouldersIWM appears to have broken the neckline of a head and shoulders pattern, consolidated in a horizontal trading range, or a rectangle, and has broken the support line of the rectangle.
Massive negative crossover of the longer term moving averages at about the same time price broke the neckline. On the Cloud, below, the Tenken crossed through the Kijun at the same time.
This is almost a "reverse" of a Parabolic Arc but to the downside as the candles are almost straight down. It would seem selling pressure would ease soon, but the market seems to be in panic mode. I figured out a long time ago that Mr. Market does not do what I tell him to do )o:
Price is under the Bollinger bands set on 80 showing an extreme oversold condition. RSI is also oversold. These conditions can go on for extended periods of time.
I scanned the chart and there are no rising wedges left in this chart to be broken. The ones that existed have already corrected.
This chart is not trading like QQQ and SPY which are very similar to each other. I am assuming this will go down with the others though, so I will mark short but maybe a bounce very soon.
No recommendation
I doubt our prior president is enjoying this, but he may be saying "I told you so". I do not think Xiden cares and his group probably sold out a while back.

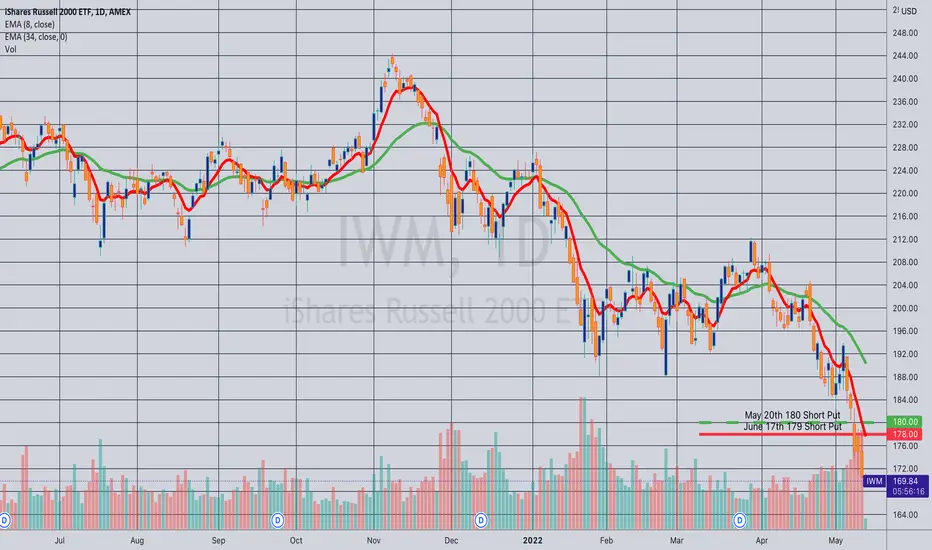
Rolling (IRA): IWM May 20th 180 Short Put to June 17th 179... for a 1.86 credit.
Comments: Not getting much strike improvement here, but collected 1% of the strike price in credit. Total credits collected of 1.90 (See Post Below) plus the 1.86 here, for a total of 3.76.
triple bottom playI bought a lot of small caps. I think this triple bottom play is going to pay off. Bought strong companies like NFLX.

Russell ETF To Correct Back to Previous HighsMarkets going through a correction with potential to see wave C end between 170-175 🎯

Russell Correction Complete? ABC bottom looking right at this point here so I'm leaning bullish
Support levels:
1. 2020 High Backtest
2. 200 Weekly EMA Backtest
3. Channel Support PA reaction

IWM bearish
bearish at least until indiscriminate selling is over
most likely going to see a bounce before taking out a major fib level

IWM Update: 6 MayThe Russell is tossed around by dip-buyers and sellers of strength. In this video I take a look at an important bullish divergence and a trade idea that can be profitable regardless of market direction if it is managed well.

IWM - Russel potential turn soon.The 0 - 5 count could be over in a couple days.
When price reaches the L-MLH, then we know that it's stretched extremely.
As a Pitchforker you know that these are the greatest opportunities to trade.
So let's observe it and maybe we find a good Risk-Reward entry.

Iwm small caps bullish violent meltup Massive inverse head n shoulder monthly with lower shoulder forming extremely bullish just regained long time support . Stochastic Rsi way oversold I’m expecting violent move up here wouldn’t be surprised if we make new highs. Buckle up

IWM: Pivotal ChangeRussell 2000 looks to be on the cusp of breaking down, after a short term distributional channel (following a longer term underperformance). We might get a small bounce back up to the prior support (as backing up action) before continue lower. There is a lack of a volume signature on the bottom of channel indicating no volume absorption like we saw last time (marked in the green box) and this suggests that we will see some acceleration to the downside. The point and figure chart suggests we a price target range of 110-140 signifying an additional 30% drop. This is entirely possible considering the slower growth and further possible war catalysts. While this, might not be the "end" yet - this warrants some portfolio hedging or at least trimming of "high valuation" positions.

IWM shortIWM Index should touch 179 - 165 before rebounding back to 200. Wait for the Index to bottom out before building large long positions in equities

IWM massive BreakIWM very weak in the larger time frames.
It has just broken below a very important support level opening some further targets.
If market continues to show weakness we could see IWM rolling over towards $172. Previous Support can be considered Resistance now and Stop loss.

Rolling: IWM May 20th 176/217 to June 17th 165/210... for a 1.26 credit.
Comments: Kind of neglected this position a bit, so rolling out, recentering risk instead of rolling down the call side to flatten net delta with 21 days to go. Total credits collected of 3.23.

Intraday puke reversal for the Russell 2000 at key levelsBuyers are stepping up right where they needed to at important multi-month lows. Let's see if the turnaround can hold for a weekly close > 188.

IWM Update: 28 AprilThe Russell is approaching a potential target zone. In this video I share an idea how to trade it with a Broken Wing Butterfly that will benefit from time decay during a potential re-accumulation. It has defined risk in case the selloff continues, and no upside risk in case the bounce happens earlier or is faster than anticipated.

Update Russell 2000Still short the Russell. Structure is breaking down once again. Russell usually leads the big indices.

IWM Daily analysis for the past 3 yearsThis IWM daily charts shows IWM has reached this bottom level 4 times in recent months (since January 2022). The last time IWM at this level was in December 2020. This bottom range between 188-193.
If IWM respects this support (STRONG SUPPORT), it will start to bounce. I would watch levels (200,211,225.. for the upsides)
Please note: This is an opinion, not an investment advice.

Crab Pattern on IWMGiven current market conditions:
1. High inflation
2. FED action to aggressively tighten monetary policy (increase interest rates and reduce balance sheet)
3. Small Caps (made up of small risky companies) struggling in high interest rates environment
I see IWM going lower from here. Target around 172 or lower even. My moving average indicator (bottom red and green curves) are also helping in the probability of this crab pattern to occur.

Time for a gut check and re-test of the Feb/March lows?let's keep some eyes on this Russell 2000 ($IWM) 190 zone this week to see if prior support holds up.

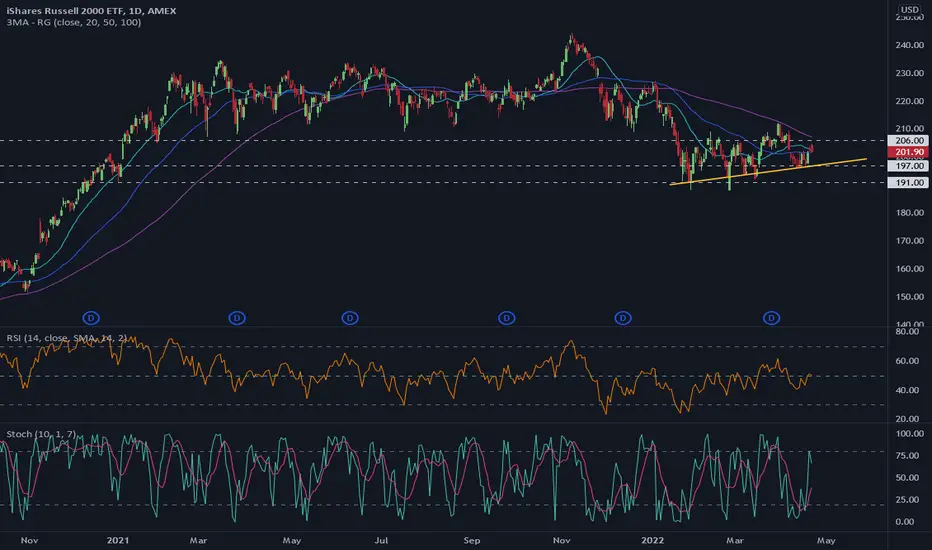
IWM back on Radar for Swing TradeDashed lines mark a few levels on chart. Sometimes zooming out in time helps to really see price trends and patterns. Here you can see price has been consolidating in a rising channel since end of Jan. The more I look at this, the more I think price will eventually break the red line and continue lower.
Signs that bearish trend continues:
> 20sma (aqua) crosses below 50 (blue)
> 100ma (purple) holds as resistance while 20/50 MA's start turning down
> RSI returns below 50
> daily close below red line with continuation lower
As I write this, price is knocking on 202, which has also been a big level for me on my 30min chart. You can see to the left that price rose steeply, and I think if this channel breaks down then price will go to 188, 180. On the weekly chart price has already turned down from 20MA and is currently sandwiched between 20 and 100 MA's.