IWM trade ideas
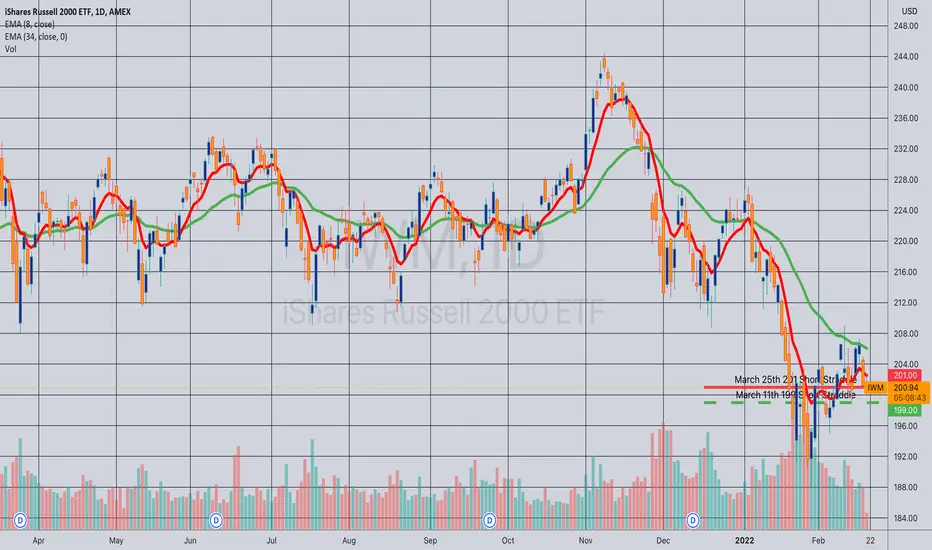
Rolling: IWM March 11th 199 Short Straddle to March 25th 201... for a 2.95 credit.
Comments: Rolling for a small realized gain here at 21 days until expiry. I've collected a total of 15.05 in credits relative to the current March 25th 201 short straddle price of 15.46, so the position is still a smidge underwater. Current break evens: 185.54 on the put side, 216.46 on the call.
$IWM LevelsBREAKOUT
🐂 $202.12
🐻$200.85
🐂 PTs
$203.51
$204.58
$205.69
$207.20
$208.94
🐻 PTs
$200.23
$198.79
$197.43
$196.28
Could be really fun to watch this drop below $200 again for a nice dip to 190/193

Opened (IRA): IWM April 1st 175 Short Put... for a 1.98 credit.
Comments: Selling premium in the broad market exchange-traded fund having the highest 30-day on the board, targeting the strike in the shortest duration contract of 45 days or longer that pays at least 1% of the strike price in credit to emulate dollar cost averaging into the broad market. I usually do this on Fridays, but if it's gonna dump on a Thursday ... .

$IWM - Bear flag break down closeIWM has been forming this bear flag over the last couple weeks. This looks picture perfect with the IWM showing a beautiful gap back at $165ish. Great time to sell some calls, buy puts, or just drop them. Markets could rally but they look ready to drop another 10-15%. Raise cash and be ready to buy when blood is in the streets!

IWMDaily Ideas
IWM forming a potential bear flag. If it break down then it is most likely going to test the low of 188. If it breaks above the 208 resistance that will be a sign of bullish reversal.

Expect more downsideEvery time IWM goes sideways for some time it break to the downside. It has this bad tendency to do that. Also lot of bad stuff going around now in the world. I expect a retest and then more downside.
$IWM LevelsBREAKOUT
$206.15🐂
$205.45🐻
RESISTANCE
$206.96
$208.29
$209.21
$210.40
SUPPORT
$204.47
$203.39
$202.33
$201.28
Looking to cover the gap later today and into tomorrow. Although showing strength with higher lows, there is no evidence to indicate a climb higher

$IWM LevelsGap up clear here, this is a hair below my support/resistance for this area. I believe that there could a tap here and move to test the high....no updated levels here. still layer four from youtube video

Distribution or Re-Accumulation for IWM?Are we witnessing accumulation in IWM before another leg higher or is this is the start of the distribution phase?
I am thinking distribution after the failed breakout at the top of the range and now a rejection at the bottom of the range after the throwback.

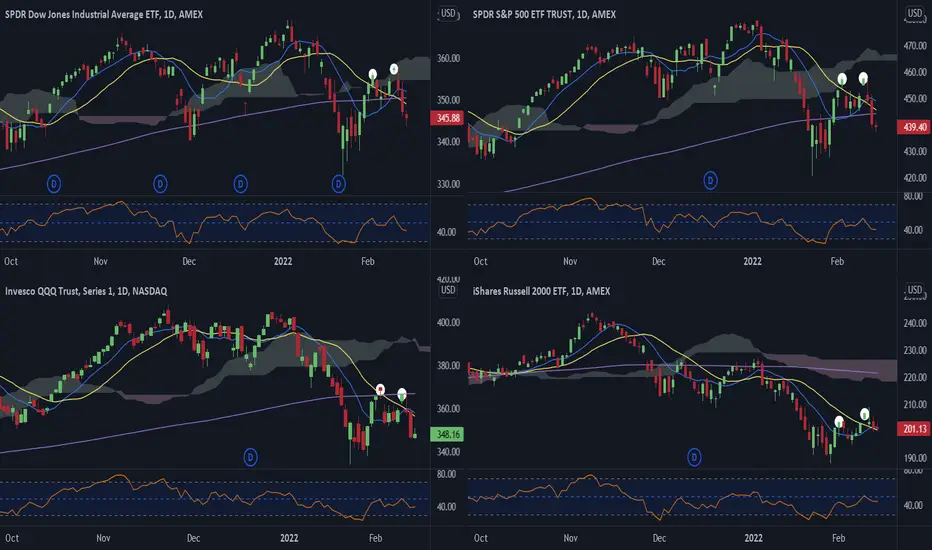
What happens after double top rally in markets?I am using index ETFs here since I use them for option trades and they are so widely traded. Study DIA, SPY, and QQQ and note the double top similarity as it corresponds to RSI. DIA and SPY were a little stronger in that RSI showed a double top above 50. QQQ had an earlier 20 below 200 ma cross, so it is weaker and its RSI did a double retest of 50. Friday's candle broke the lows on these three charts and technically triggered more downside.
However, in this anything can happen market, there is a possibility that this Friday-Monday pullback results in another move higher before making new lows. For trading, this means be patient and do not over-commit to one direction. You can start a smaller swing position and add more puts when you have more confidence in the trade.
Also, though not shown here, stochastic %K has given a sell warning on the daily chart. The candles from 9-11 Feb moved %K from above 80 to below 20. Sometimes more downside follows immediately, while more often there is a price bounce up first as %D is still making its way lower. I cannot predict which will happen but I know to be on the lookout for a reason to buy puts.
I want to discuss IWM separately, as it does not have the same double top formation on RSI and price. IWM is more bearish, as 20sma crossed below 200 earlier, and so this chart is weaker. When you look at its weekly chart and indicators, you may want to buy swing puts.
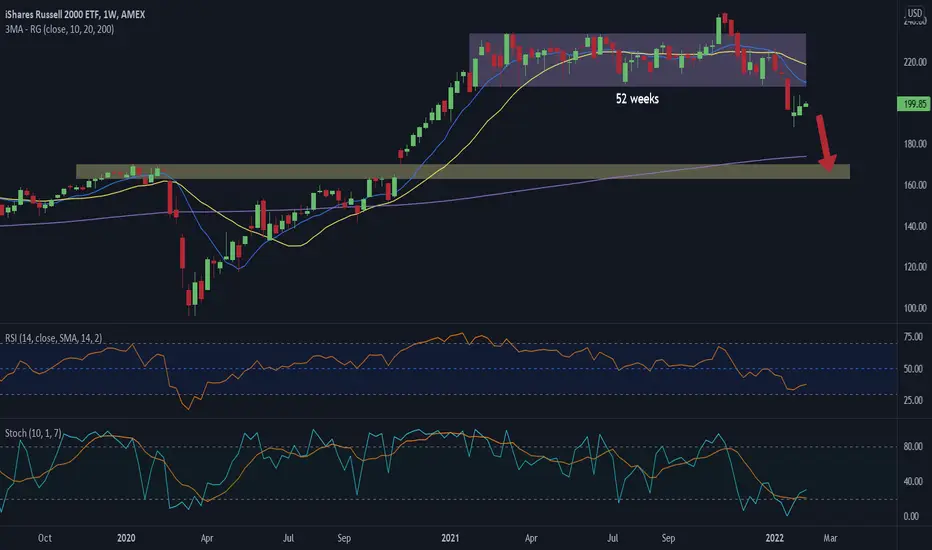
Swing puts near 200 - One year range adds weight to sellingIf markets broadly sell off again, IWM can fill the gap down in the yellow band. In general, the longer price stays rangebound, the greater the move when that range breaks.
100% distribution IWM is in the final phase of a wyckoff distribution cycle.
Its pretty obvious to where this is heading, and where we get our bounce. ( green trend line )
but before we get there, i see a quick little drop to the high 180s (186 to 188) then a little run to retest that downward resistance and then that is when we will get our bounce on the green trend line.
which also lines up to where a distribution cycle would end... ( where the last accumulation ended)
plus its time they remove the covid band-aid
price target 160 to 170... but end of March.
Good luck.

IWM putsBroke major support and currently retesting and rejecting it. Ascending triangle break on daily could be good shorter term play for puts down to next support @ PT1

IWM 1D IWM is currently in a make or break spot, with the potential to drag the market higher if it can show some strength.

Rolling (IRA): IWM February 25th 193 Short Put to March 31st 178... for a .58 credit.
Comments: The 193 isn't at 50% max yet, but it's the highest strike I've got in my short put ladder, so taking the opportunity to both realize a little gain, strike improve, and receive a credit for doing it. Total credits collected of 2.09 (See Post Below) +.58 = 2.67 relative to a current price for the March 31st 178 of 1.93, so I've realized gains of .74 ($74) so far.

Rolling (IRA): IWM February 18th 194 Short Put to March 25th 178... for an .83 credit.
Comments: With only 7 days to go, rolling down and out to the strike paying at least 1% of the strike price in credit. Total credits collected of 3.53 (See Post Below) + .83 = 4.36 relative to the March 25th 178's current value of 1.80, so I've realized gains of 2.56 ($256) so far.

$IWM Russel 2000 - Small caps previous support now resistance?Small caps tend to lead the market. Not a great picture as we saw a strong reversal off previous support yesterday. Technically we have the 50dma trading below both the declining 200day sma and emas. The moving averages are pointing down and we are still under the anchored vwaps from the previous highs. We also seem to be forming a rising wedge formation which are usually continuation patterns in the direction of the previous trend (currently down). Not much to be bullish about in this chart, so odds are in favour of further downside, unless we can climb above a mountain of significant resistance levels above (something which seems unlikely at this stage).

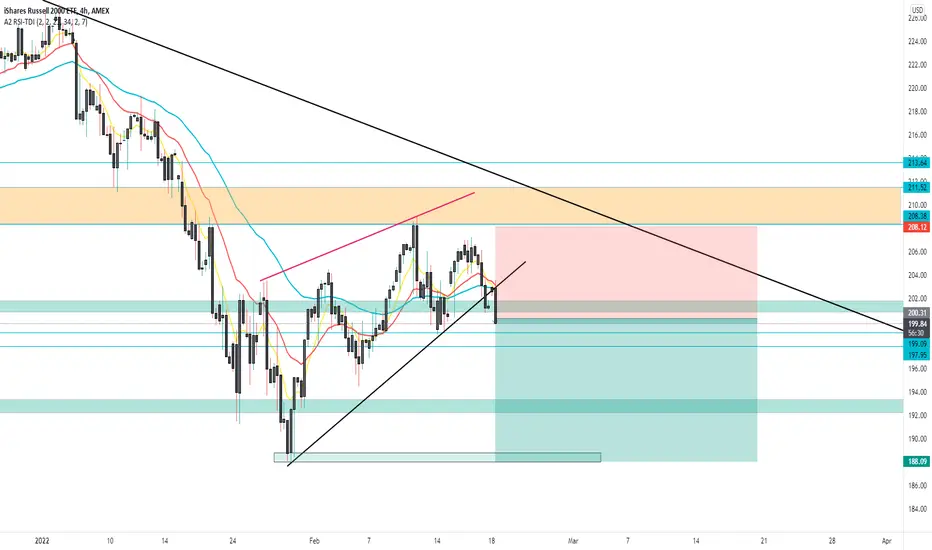
IWM: Handoff RejectionIWM rejected a crucial AVWAP handoff and appears to be giving us a low risk short entry. Notice how price action gave us a repetition of the previous distribution pattern before moving to the downside. That quick fake above the handoff should add fuel to the flame.

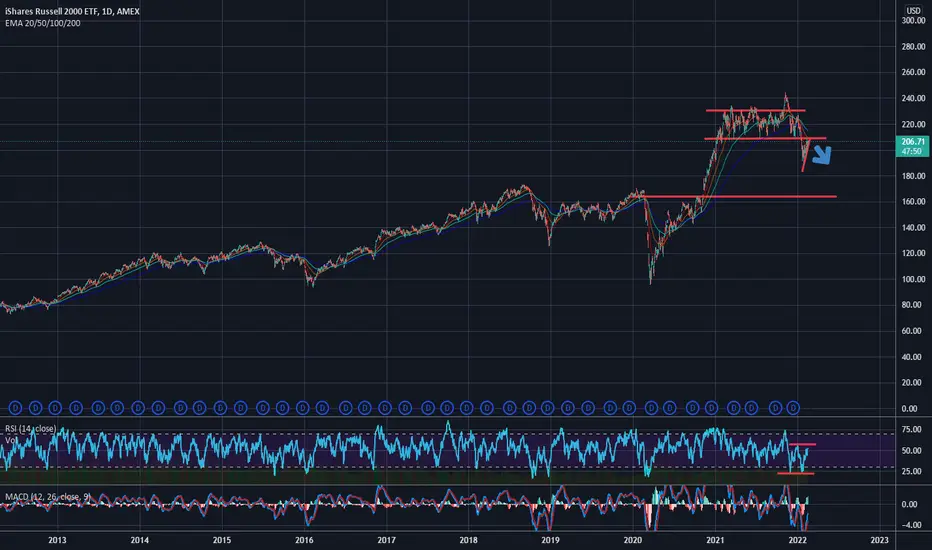
IWM MAJOR UPSWING THE BEAR ENDED The wave structure has dropped in a perfect A=C From the Peak to the low 2020 . and has dropped also a near perfect FIB .382 LOOK FOR BIG RALLY IT HAS STARTED . It dropped to the panic cycle fore cast date jan 27 +or - 1

Bearish SharkI have been following this bearish Shark forming on the 2hr chart for a bit. I think there is a great shorting opportunity that will presents itself soon. Understanding the market structure and the macro environment, there is no rush to take bearish trade, but one should be ready as tightening cycle starts to become reality. Should be an interesting next few weeks. All the best!

IWM at critical resistance before reversal or next levelWill it go up or down? IWM at critical resistance before reversal or next level.

$IWM — Market Forecast UpdateThe Russell2000 needs to be stopped; the small cap index is filled with flaky names that have yet to make profit.
These companies, for the most part, don't earn money.
This index will continue to get crushed.
We played the upside breakout to 240s, and we also played the downside break to 190s.
I called the top on this index at 225.
I am forecasting lower.
The CCI is egregiously overextended, we have pitiful volume on strong moves to the upside, and we just created a gap from today's strong move higher.
We have a recipe for a 500% trade with put options.
