JPM + $500B Capital Forecast + Banks to Profit from Tar NYSE:JPM , 4H chart
ALVO13 Insight: A strong mix of technical structure and positive fundamentals.Technical Setup (Elliott Waves):
The chart suggests a potential start of wave (5) after a completed correction (4).
Stochastic is in the oversold zone, and $280 support is holding — a key signal for a possible reversal.
Key Levels:
• Support: $280.00–280.47
• Resistance: $295.73–298.02
• Target (Wave 5): $315.67
Fundamental Factors:
JPMorgan forecasts up to $500B in new equity inflows from retail and institutional investors during H2 2025. This could lift the market, especially financials.
Banks are likely to benefit from upcoming trade tariffs — via increased demand for hedging, transaction fees, and advisory services.
PM remains one of the most solid U.S. banks, with strong dividend policies and excellent return on equity (ROE).
ALVO13 Trade Idea:
• Entry: $282–286 (confirmation-based)
• Stop-loss: below $280
• Take-profit: $315+
• Risk/Reward: 3:1
Break below $280 invalidates the bullish wave 5 scenario.
JPM trade ideas

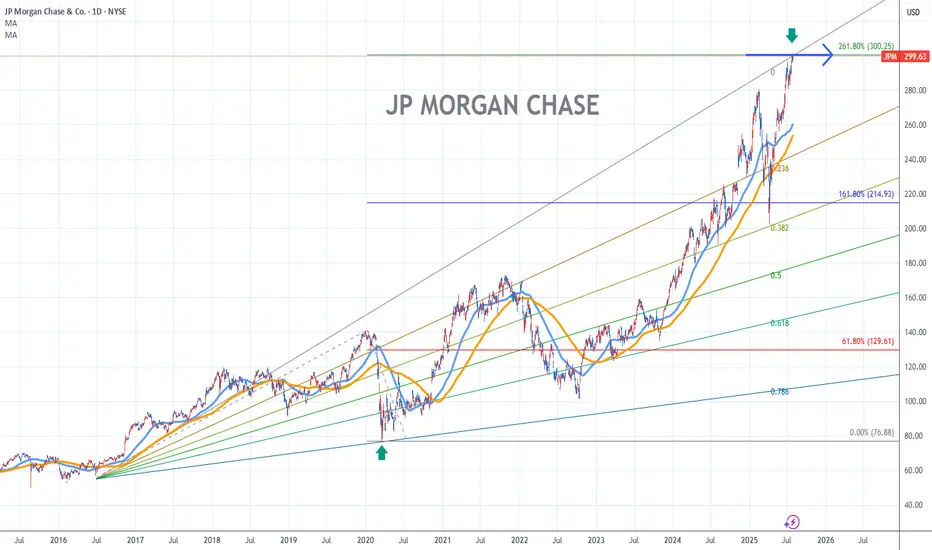
JP Morgan Chase Stock Chart Fibonacci Analysis 073025Trading Idea
Hit the 300/261.80% resistance level.
Chart time frame:D
A) 15 min(1W-3M)
B) 1 hr(3M-6M)
C) 4 hr(6M-1year)
D) 1 day(1-3years)
Stock progress:E
A) Keep rising over 61.80% resistance
B) 61.80% resistance
C) 61.80% support
D) Hit the bottom
E) Hit the top
Stocks rise as they rise from support and fall from resistance. Our goal is to find a low support point and enter. It can be referred to as buying at the pullback point. The pullback point can be found with a Fibonacci extension of 61.80%. This is a step to find entry level. 1) Find a triangle (Fibonacci Speed Fan Line) that connects the high (resistance) and low (support) points of the stock in progress, where it is continuously expressed as a Slingshot, 2) and create a Fibonacci extension level for the first rising wave from the start point of slingshot pattern.
When the current price goes over 61.80% level , that can be a good entry point, especially if the SMA 100 and 200 curves are gathered together at 61.80%, it is a very good entry point.
As a great help, tradingview provides these Fibonacci speed fan lines and extension levels with ease. So if you use the Fibonacci fan line, the extension level, and the SMA 100/200 curve well, you can find an entry point for the stock market. At least you have to enter at this low point to avoid trading failure, and if you are skilled at entering this low point, with fibonacci6180 technique, your reading skill to chart will be greatly improved.
If you want to do day trading, please set the time frame to 5 minutes or 15 minutes, and you will see many of the low point of rising stocks.
If want to prefer long term range trading, you can set the time frame to 1 hr or 1 day.

$JPM Tradespoon – Long Entry $296.36Tradespoon model generated long signal for NYSE:JPM . Predicted range: $296.36–$298.79. Trend: +0.10%. NYSE:JPM

US Banks on Fire | Revenues Soar, and So Do the ProfitsWho Needs a Recession? Banks Are Swimming in Cash!
The largest U.S. banks have reported some of their best quarterly performances in recent years, with surging trading revenues, a resurgence in dealmaking, and an overall renewal of corporate confidence playing pivotal roles. Let’s break down the key details of the results.
Market Recovery
Across the major banks, investment banking and trading activities recorded impressive performances. Goldman Sachs saw investment banking revenue increase by 24%, while Bank of America (BofA) experienced a massive 44% jump, marking its strongest quarter in three years.
The market volatility stemming from factors like the U.S. election and changing expectations around interest rates continued to fuel robust trading revenues. Morgan Stanley’s equities division, for example, reached an all-time high, while JPMorgan and Goldman Sachs enjoyed notable gains in fixed-income trading.
A surge in CEO optimism has led to an uptick in mergers and acquisitions (M&A), initial public offerings (IPOs), and private credit demand. Morgan Stanley, in particular, is seeing the largest M&A pipeline in seven years, signaling a sustained wave of dealmaking.
Mixed Results for NII
Net interest income showed varying results across the banks, but forward guidance indicates that NII will likely see moderate growth in 2025, spurred by continued loan demand and higher asset yields.
Credit Risks on the Rise
Consumer lending pressures have persisted, with JPMorgan’s charge-offs rising by 9%. Many banks are preparing for a further increase in delinquencies, particularly in credit cards.
Commercial Real Estate Challenges
While the office sector remains under stress, banks are managing their exposures cautiously and have yet to face significant shocks in this area.
Regulatory Scrutiny Continues
Citigroup lowered its 2026 profitability target as it undergoes a transformation, while Bank of America faced increased scrutiny over its anti-money laundering compliance.
Resilient U.S. Economy
Banks are reporting strong consumer spending, loan growth, and corporate profitability, which supports an optimistic outlook for earnings growth heading into 2025.
Performance Breakdown for Each Bank
JPMorgan Chase
- JPMorgan posted a record annual net income of $58.5 billion, marking an 18% increase from the previous year.
- Investment banking saw a 46% surge in revenue, driven by strong advisory and equity underwriting.
- Trading revenue climbed by 21%, led by a 20% increase in fixed-income trading.
- Despite the impressive results, JPMorgan is still facing challenges such as rising charge-offs and pressures on loan margins. CEO Jamie Dimon emphasized concerns about persistent inflation and growing geopolitical risks.
Bank of America
- BofA experienced an 11% year over year growth in revenue, reaching $25.3 billion, with net income up 112% from the previous year.
- The investment banking division saw a dramatic 44% rise in revenue, the highest in three years, thanks to strong debt and equity underwriting.
- Trading revenue grew by 10%, driven by solid performance in fixed income (up 13%) and equities (up 6%) as market volatility spurred client activity.
- BofA also reported growth in its consumer and wealth management divisions, with credit card fees and asset management showing strength. Client balances grew to $4.3 trillion, a 12% increase from the previous year.
- After several quarters of decline, BofA’s NII grew by 3%, exceeding expectations and signaling stability. The bank expects NII to continue rising through 2025, with projections of $15.7 billion per quarter by the end of the year.
Wells Fargo
- Wells Fargo’s revenue remained flat at $20.4 billion, but net income surged by 50%.
- NII declined by 8% year-over-year but is expected to rise slightly in 2025 due to higher reinvestment rates on maturing assets.
- The bank made significant progress in cost-cutting efforts, reducing non-interest expenses by 12%, thanks to workforce reductions and efficiency initiatives.
- Investment banking fees rose by 59%, benefiting from the broader market recovery and the bank’s renewed focus on its Wall Street presence.
- Wells Fargo returned $25 billion to shareholders in 2024, including a 15% dividend increase and $20 billion in stock buybacks. However, the bank continues to face regulatory constraints, notably the asset cap imposed by the Federal Reserve.
- Looking ahead to 2025, Wells Fargo anticipates modest growth in fee-based revenue, with cost discipline and efficiency gains driving improvements.
Morgan Stanley
- Morgan Stanley saw a 26% increase in revenue, reaching $16.2 billion, while net income soared by 142%.
- Equity trading revenue jumped by 51%, setting a new all-time high as market volatility sparked increased client activity, particularly in prime brokerage and risk-repositioning trades.
- Investment banking revenue grew by 25%, fueled by strong demand for debt underwriting, stock sales, and M&A activity. CEO Ted Pick noted that the M&A pipeline is the strongest in seven years, signaling a potential multi-year recovery in dealmaking.
- Morgan Stanley’s wealth management division saw $56.5 billion in net new assets, increasing total client assets to $7.9 trillion. The firm is pushing toward its goal of $10 trillion in assets under management.
- In response to growing business complexities, the firm launched a new Integrated Firm Management division to streamline services across investment banking, trading, and wealth management.
Goldman Sachs
- Goldman Sachs experienced a 23% increase in revenue, reaching $13.9 billion, while net income more than doubled, up 105%.
- Record performance in equity trading contributed to a 32% increase in revenue from this segment, as market volatility drove greater client activity.
- Investment banking revenue grew by 24%, boosted by significant gains in equity and debt underwriting.
- The firm’s asset management division saw an 8% rise in assets under management, reaching $3.1 trillion, while management fees exceeded $10 billion for the year.
- Goldman is winding down legacy balance-sheet investments but also saw a gain of $472 million from these investments in Q4. The firm’s recent launch of its Capital Solutions Group is aimed at capturing growth opportunities in private credit and alternative financing.
Citigroup
- Citigroup posted a 12% increase in revenue, reaching $19.6 billion, with non-interest revenue surging 62%.
- Fixed-income and equity markets were key drivers, growing 37% and 34%, respectively, as market volatility tied to the U.S. election boosted performance.
- Investment banking revenue climbed by 35%, supported by strong corporate debt issuance and a pickup in dealmaking activity.
- The bank unveiled a $20 billion stock repurchase program, signaling confidence in future earnings.
- Citigroup also made strides in controlling operating expenses, which declined by 2% quarter-over-quarter. However, the bank lowered its 2026 return on tangible common equity (RoTCE) guidance to 10%-11% due to the costs of its ongoing transformation.
- CEO Jane Fraser emphasized Citigroup’s long-term growth trajectory, noting improvements in credit quality and continued progress with the strategic overhaul, including the postponed IPO of Banamex, the bank’s Mexican retail unit, now expected in 2026.
Long story short
Heading into 2025, the major U.S. banks are in strong positions, buoyed by a favorable economic backdrop, continued growth in trading, and a rebound in corporate dealmaking. Despite challenges such as rising credit risks, regulatory hurdles, and potential macroeconomic uncertainties, the outlook remains positive. With a recovering IPO market, continued wealth management growth, and strong trading revenue, the banks are poised to capitalize on the renewed corporate optimism. The key question will be whether the dealmaking frenzy continues or whether uncertainties in the global economy and market dynamics could temper the rally.

JPM Breakout in Play – Target $295+
🧠 Chart Analysis Summary:
Pattern: Symmetrical triangle breakout has occurred. Momentum is building.
Current Price: $288.58
Breakout Confirmation: Price closed above resistance trendline (pink), signaling potential bullish move.
📊 Key Levels:
Entry Zone: $288.50–289.00
Resistance/Targets:
Minor Resistance: $291.87 (red line)
Main Target: $295.54 (green line)
Support Zone:
$284.00–285.00 (white zone, strong base)
🎯 Trade Plan (Bullish Setup):
Entry: $288.60
Target: $295.00–295.50
Stop-Loss: Below $284.00

JPMorgan Chase Wave Analysis – 10 July 2025- JPMorgan Chase reversed from support zone
- Likely to rise to resistance level 296.00
JPMorgan Chase recently reversed up from the support zone between the support level 280.00 (former multi-month high from January), support trendline of the daily up channel from April and the 38.2 Fibonacci correction of the upward impulse 1 from May.
The upward reversal from this support zone continues the active intermediate impulse wave (5) from the end of May.
Given the clear daily uptrend, JPMorgan Chase can be expected to rise to the next resistance level 296.00 (top of the previous impulse wave 1).

JPM. Earnings, then a correction 255 is my target here which represents a 10-13% correction from current levels
I doubt we break below 250 before sept.. eventually this stock will head back to the bottom of its long term channel
For now I think we close this gap at 279 .. most likely a bounce will come there because of the daily 20ma
Price could close gap at 292 with earnings and then fade from there
Price could trade inside this wedge for the next year
Logarithmic scale used

JPM: Internal CadenceResearch Notes
Testing coordinates of full fractal cycle for deterministic properties. If we base our core measurements (0; 1) on that shape:
Interference Pattern I - adjusted to the angle of building blocks
Interference Pattern II
Interference Pattern III
This explains all Fibonacci channels shown in interactive chart.

JPMorgan Chase Wave Analysis – 3 July 2025- JPMorgan broke key resistance level 280.00
- Likely to rise to resistance level 300.00
JPMorgan recently broke above the key resistance level 280.00 (which stopped the earlier sharp upward impulse wave (5) in February).
The breakout of the resistance level 280.00 accelerated the active impulse wave 3 of the medium-term impulse wave (5) from May.
Given the clear daily uptrend, JPMorgan can be expected to rise to the next round resistance level 300.00 (target price for the completion of the active impulse wave 3).

JP Morgan (JPM) – Momentum Continuation SetupAfter a strong rebound from the spring lows, JPM shares have broken through a key resistance level and are holding above $260. With expanding Bollinger Bands and increasing volume, I’m looking for a continuation of the upward move.
Target: $280.47
Upside Potential: +4.68%
Stop-Loss: $232.26
Risk/Reward: controlled, with flexibility to adjust as the trend develops.
Fundamentally, JP Morgan remains one of the strongest players in the banking sector, delivering solid earnings and benefiting from the current macro environment.
ALVO13 – trading smart, growing strong.

$JPM – $50B Buyback Meets Premium Liquidity ZoneChart Thesis (1D | Smart Money Concepts | LuxAlgo | ORB)
JP Morgan ( NYSE:JPM ) has surged into a premium pricing zone right after announcing a $50 billion buyback + dividend hike.
🔴 Key Zone:
Price is currently sitting inside a Premium + Weak High liquidity pocket
We’re in a potential distribution range at the highs
🔵 Liquidity Magnet Zones:
$260–265: Massive uncollected liquidity zone
$244–248: Equilibrium reversion pocket
$228–232: Deep liquidity + structural strong low
⚠️ Trade Strategy (DSS-Aligned):
Watch for a liquidity sweep and rejection above $291
If SMC confirms BOS (Break of Structure) on lower timeframe → Expect short setup targeting $265 first
Failing to reject = momentum push to $296–302
📊 Volume Context: Volume is diverging — suggests smart money is potentially offloading here.
🎯 WaverVanir Trade Plan
Parameter Value
Entry (aggressive short) $291–$295
TP1 $265 (major liquidity)
TP2 $244 (Equilibrium)
SL $296+ breakout zone
Bias Bearish short-term, bullish long-term
Signal Strength 7.2/10 (DSS Tier 2)
Are institutions front-running or unloading? We’re watching volume, ORB sweeps, and Smart Money behavior.
🧠 Follow for more WaverVanir institutional-grade chart flows.
#JPM #SmartMoneyConcepts #LiquidityZones #Buyback #DividendStocks #Fintech #Trading #WaverVanir #DSS #OptionsFlow #MarketStructure

JPM SELL!!JPM and GS are both overbought here. This market is a bubble like we've never seen the valuations are pie in the sky. Id sell calls here as we'll have a correction on these two names in the next couple of weeks 3 x book wtf

JPMorgan Chase (JPM) Gaining Bullish TractionPM is exhibiting strong bullish behavior, with price action pushing higher on increasing momentum
The stock has cleared key short-term resistance levels, signaling confidence among buyers
Volume trends are supportive, and technical indicators point to sustained upside potential
As long as JPM holds above its recent breakout zone, the path remains favorable for further gains
Investors should watch for continuation signals or healthy pullbacks for potential entry points
The broader market tone also supports strength in financials, adding conviction to this move
#JPM #JPMorganChase #TechnicalAnalysis #MomentumPlay
#JPMorgan #Bullish #Stocks #Momentum #TradingUpdate
JPM – Long Trade Setup (30m Chart)!📈
📍 Entry: $273.95 (Breakout from wedge)
🛑 Stop-Loss: $277.38 (Below key resistance zone)
🎯 Target: $280.90 (Upper resistance)
🎬 Short YouTube Caption (7 words per line max):
🔹 Wedge breakout confirms bullish strength
📈 Clean retest at breakout zone
🎯 Targeting $280.90 with solid volume
🛡️ Risk defined – Smart long trade

Buy Idea: JPMorgan Chase & Co. (JPM)Exchange: NYSE
Sector: Financials – Major Banks
Setup Type: Volatility Contraction Pattern (VCP) Breakout
⸻
📈 Trade Thesis:
JPM is breaking out of a tight consolidation near all-time highs following a multi-week VCP setup. Volume expanding on breakout, supported by strong sector rotation into financials amid rising bond yields.
⸻
🔑 Technical Setup:
• Entry: $268.50 - 269.50
• Stop: $260.80 (below breakout base, protects against failed move)
• Target 1: $278.00 (psych level + previous breakout projection)
• Target 2: $290.00+ (trend continuation toward ATH range)
• Risk/Reward: ~1:2.5
⸻
📊 Confluence Factors:
• Price above 21EMA, 50MA, 200MA – trend alignment ✅
• VCP structure with declining volume pre-breakout ✅
• Relative Strength vs. SPX improving ✅
• Sectoral tailwind (banks outperforming vs tech rotation) ✅
• Clean flat base breakout – momentum entry zone ✅
⸻
📌 Trade Management Notes:
• Consider trimming 1/3 near $278, trail rest above $272
• Tighten stop to breakeven once price closes 2 consecutive days above $274
• Earnings scheduled July 15, 2025 – manage exposure ahead of report
DISCLAIMER : The content and materials featured are for your information and education only and are not attended to address your particular personal requirements. The information does not constitute financial advice or recommendation and should not be considered as such. Risk Management is Your Shield! Always prioritise risk management. It’s your best defence against losses.

JPM on WatchJPM on Watch
Looking for a breakout over $169.50 with volume.
Why:
Bounced off red 20d EMA
Approaching resistance
MACD looks ready for a bullish crossover


JPM eyes on $266: Double Fib resistance could POP or DIPJPM rebounding with all banks but now at resistance.
Watching double fib confluence at $266.07-266.47 now.
Break could run to $280 above, dip to $254.96 or 252.21

JPMorgan’s Tight ActionJPMorgan Chase has been consolidating for weeks, and some traders may expect resolution to the upside.
The first pattern on today’s chart is the gap on May 12 after Treasury Secretary Scott Bessent signaled progress in trade talks with China. The news pushed JPM above $263, and the stock has chopped on either side of that level since.
In the process, Bollinger Bandwidth has narrowed to the bottom of its longer-term history. Could that tight price action give way to expansion?
Third, the megabank stalled around $255 in early March and late March. The current consolidation has occurred above that level, potentially suggesting that old resistance has become new support.
Next, the series of lower highs since May 15 has created a falling trendline. That resistance may provide a reference point for a potential breakout.
Finally, the 8-day exponential moving average (EMA) has remained above the 21-day EMA.
TradeStation has, for decades, advanced the trading industry, providing access to stocks, options and futures. If you're born to trade, we could be for you. See our Overview for more.
Past performance, whether actual or indicated by historical tests of strategies, is no guarantee of future performance or success. There is a possibility that you may sustain a loss equal to or greater than your entire investment regardless of which asset class you trade (equities, options or futures); therefore, you should not invest or risk money that you cannot afford to lose. Online trading is not suitable for all investors. View the document titled Characteristics and Risks of Standardized Options at www.TradeStation.com . Before trading any asset class, customers must read the relevant risk disclosure statements on www.TradeStation.com . System access and trade placement and execution may be delayed or fail due to market volatility and volume, quote delays, system and software errors, Internet traffic, outages and other factors.
Securities and futures trading is offered to self-directed customers by TradeStation Securities, Inc., a broker-dealer registered with the Securities and Exchange Commission and a futures commission merchant licensed with the Commodity Futures Trading Commission). TradeStation Securities is a member of the Financial Industry Regulatory Authority, the National Futures Association, and a number of exchanges.
TradeStation Securities, Inc. and TradeStation Technologies, Inc. are each wholly owned subsidiaries of TradeStation Group, Inc., both operating, and providing products and services, under the TradeStation brand and trademark. When applying for, or purchasing, accounts, subscriptions, products and services, it is important that you know which company you will be dealing with. Visit www.TradeStation.com for further important information explaining what this means.

Quick View: $JPM
- Bullish consolidation on the hourly chart
- Bullish scenario on the daily chart with confirmed crossover not supported by volume
Area of $267 as key resistance.
Support → $256

JPM, possible correction JPM showing in 4 hours time frame a negative diverging indicates a weakness and a pullback , technically to touch the trend line "back to the scene of crime"

JPM LongJPM is now net long on the regression break.
I am not taking this trade, as there is a limit on the tariff pause.
