Long KSS for a breakoutThe daily chart of KSS shows continued sideways consolidation in a Wave-4 triangle. It is a clean impulsive sequence, with a simple zig-zag correction in Wave-2 and an extended Wave-3. Alternation between the corrective waves strengthens the conviction in the setup. A break of the triangle should take price higher toward 70, although it's difficult to predict when that will happen. Triangles tend to extend sideways longer than expected. Initiating a long position with an immediate profit target at 70, with an extension up to 72.50. A move below 55 invalidates the setup.
KSS trade ideas


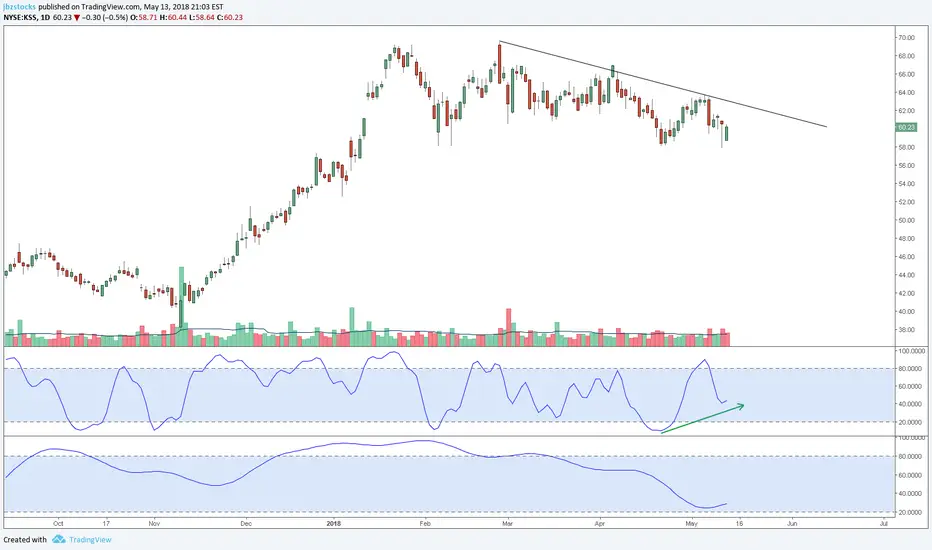

KSS - Short - Looking weakThis looks like it's under distribution, it could get juicy if investors decide to flee. Under 50 MA!


Upcoming Roller Coaster For Kohl's (KSS)Putting Elliott Wave Theory To Work. I have made the first of six trades today with three planned positions over the next 3 months. After breaking down the KSS chart at a technical level, I have forecasted 3 rough price points (68.42, 61.22, 75.62).
PLAN #1
Entered first position at 63.37 on January 12
Plan to exit around 68.42 around January 18
This would be around an 8% gain
PLAN #2
Plan to short after the exit around 68.42 on January 18
Plan to exit around 61.22 on February 23
This would be around a 10.5% drop for stock
PLAN #3
Plan to enter long position around 61.22 around February 23
Plan to exit around 75.62 around April 18
This would be around a 23.5% gain

KSS waiting for a breakout or breakdownKSS is a wait and see but it should run a lot once it decides which way it will go. I am starting a video log of my trades so you can see my first one here: youtu.be


11.27.17 | KSS | DailyJournal Entry: I have drawn a rising wedge and various lines of supply, demand, support, and resistance. I am targeting price to move lower to at least the first Fibonacci line. I am noting the bullish wave was created on declining overall volume and the bearish pressure is building on increasing relative volume. That's all the time I have tonight folks. Thank You, God Bless.

Short Kohl's from 39.90 to 37.00 Short KSS- excellent short play on the charts...retail weakness coming up!

Kohl's Potential Long Term Investment at Pendulum Low Broadline Retailers are strong.
Several companies in the peer group of Kohl's (like Macy's - M) are at Pendulum Low and showing signs of stabilization.
Between M and KSS, KSS has stronger fundamentals.
Kohl is at Pendulum Low - a low enough price to start looking for Long Term Buy in good companies.
Kohl has a recognizable and positive brand name.
The risk is small as Stop Loss is narrow.
forums.superiorprofit.co
www.screencast.com


$KSS End of the selling?Well, ask me in about 2 weeks and I will give you a certain answer.
Price pushed out of range this morning after 3 decent size days of selling. Got back within the lower limit of the 30 Linear Regression channel.
Buyer's showed up. Got in at $37.05.
Not a bad company, making money but members of the retail group are not too popular these days.

"KSS" Very likely downfall on earnings report, TODAY!I'm sure everyone that can maintain a body temp of around 96 degrees, understands that Kohls has been a failing company for the last 2 years. For the short term traders, I have setup a very simple but concise support/resistance chart. As you can see it's prone to fall, as the resistance barricades the stock 4 times in one week interval. There are 8 highly regarded analysts that forecast an earnings per share of $1.32. This value represents a 16.46% decrease compared to the same quarter last year. KSS totally fumbled their earnings per share during the 2nd calendar quarter of 2016 by -13.89%. This is just more evidence suggesting a decrease in stock price. The 2017 Price to Earnings ratio for KSS is 11.51 vs. an industry ratio of 29.50. Implying that they will have a lower earnings growth than their competitors in the same industry. In Layman's terms...the company is tripping over its own two feet, so pull up for the show. In case you make poorly executed trade, the public knows that Kohl's downfall inevitable. Its not a matter of if, but when.
Thank you for your time:)
Instagram @zillionare_zone


Another volatility spikeSame story as Macy's:
- Disappointing Christmas sales
- Disappointing, revised guidance
- Double broker downgrade
Stock indicated down 15%
Wide gap (46-49) to be bridged
Volatility should spike accordingly
Opportunity to sell 10% OTM puts on the 20 Jan maturity

KSS: Good level to add to longs, or get in if flatI think we have good odds here. Risking a drop to 34.57 is conservative, you could also wager on price not going under 39.50 but I'd rather have more margin of error initially. I'm long from higher and doubled my position here since I think it's a low risk spot for the post earnings momentum to end.
Within the next 3-5 days we should see price move higher. The estimated earnings level lies at 46.61, it's not yet confirmed but it should be close to where the last earnings release key level will be. A 2.8% to 5.6% position is fine for the first entry, to then add as you can reduce the stop loss distance with more confirmation of upside.
Good luck,
Ivan Labrie.

KSS: Getting good to buy it back againI'm watching $KSS here, I'd like to buy as close to support as possible. There's an interesting time/price juncture below, where the bottom of the uptrend's linear regression channel meets both the Key Earnings Level, as well as the uptrend speedline support, making it an ideal spot to buy.
This also happens to coincide with a potential bearish range expansion failure, where today's decline would fail to validate the bearish momentum, giving way to a good buy setup.
Risk a drop under $46.40-$42.40 initially, and buy a 10% position gradually during a week or two.
Good luck,
Ivan Labrie.

KSS: Key Hidden Levels signalsIn this chart I describe the trading signals generated by Tim West's techniques, in particular the methods revolving around the RgMov and Key Earnings Support indicators. You can see signals that failed are very few, and the trade setups obtained in one year have been really precise if executed correctly.
If you're interested in learning the specifics of this discipline, and getting information of new stocks to watch, trade setups fresh from the oven, or in private tuition or trading signals, contact me, and don't forget to stop by the KHL chatroom ( www.tradingview.com ), where me, my good friend Nick Coulby and our mentor, Tim West, usually share ideas and commentary, and new members and subscribers to the indicator pack, can discuss and ask for advice as well.
Cheers,
Ivan Labrie.

KSS Long Term "Trade"KSS had a great season with good growth.
Improved retail spending is sending revenue streams higher.
First target is anywhere over $50.
Final target if $50 breaks is $60 for 2016.


KSS right at monthly support?KSS is right at monthly support which if not held should lead to early 30's. Can go to 40 exact and bounce. On watchlist.
