L Brands (LB) Long Term or Swing Trade Buy OpportunityLB is at CUE Pendulum Low - that is, a Low enough price to take a Buy Position for Long Term Investing.
It is near Low point - meaning its Stop Loss is narrow.
Potential profit is much higher.
Both Weekly Backdrop and Daily Hop On charts using CUE Templates are showing Bullish signs after dropping a lot in previous months.
Also, Apparel Industry, to which LB belongs, improved in its rank in the previous week.
All these points to a valid Long Term Buy Position potential in a strengthening Industry while also allowing for narrow Stop Loss.
It could also be taken as a Swing Trade Long Position.
LBC trade ideas


Long trading from a correctionThe LB Brands are in a defined Moving up Trend. The last days are the corrections like a distribution phase.
Now it is time to go back in up trend. If the price jumps over 74,30 the potential are the 80's..

Retail Stocks Set to Soar LB Brands | 1 Week ChartVictoria Secret, Earnings, Back to School and Holidays Coming up
New Release of Profit Wave Alerts, Reserve your Spot for a Free Demo t.co


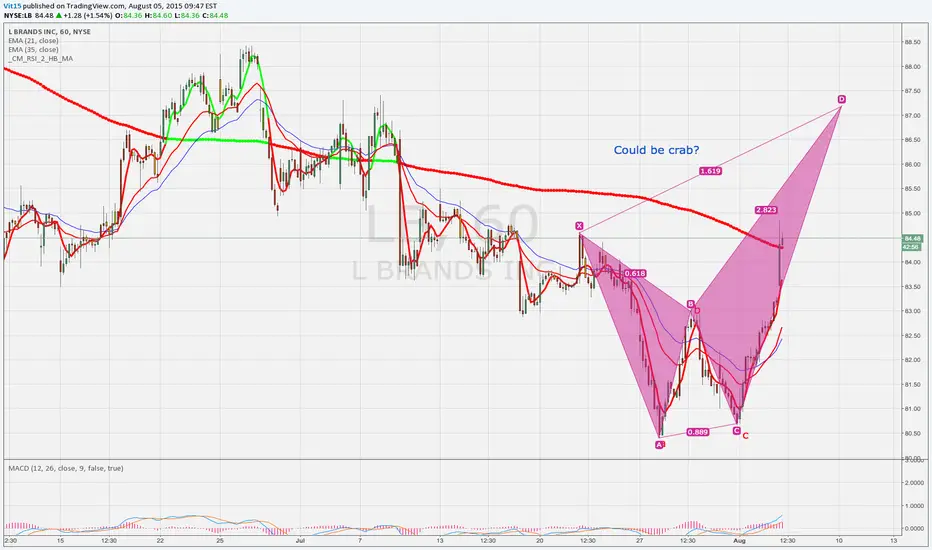
LB StrangleThis is a very good example of when to do a strangle. The market is about to choose which direction to go in soon. You have NFP tomorrow, earnings for LB in 2 weeks, and a rate hike decision coming up. This is the perfect cocktail to take advantage of a big move. LB is down 11.7% today and could potentially continue down further. I have no idea which way LB will go, but I expect to make a profit on my 75 strike call 70 strike put strangle setup. I bought this setup 45 days to expiry and only paid a net debit of 4.00. You should see a nice move soon.
Cheers


LB breaking outLB made it’s low in 2009 around $10 and has trended well ever since. Price found resistance at 65,35 in December 2013 and pulled back slightly below round number 50. It took several months for LB to return to the uptrend but when it finally managed to break the pivot high in October 2014, price moved really fast and currently we are just above 90 with no clear resistance until the big figure 100.
Yesterday, LB broke above a multi-week consolidation zone giving us an opportunity t add to our profitable positions.

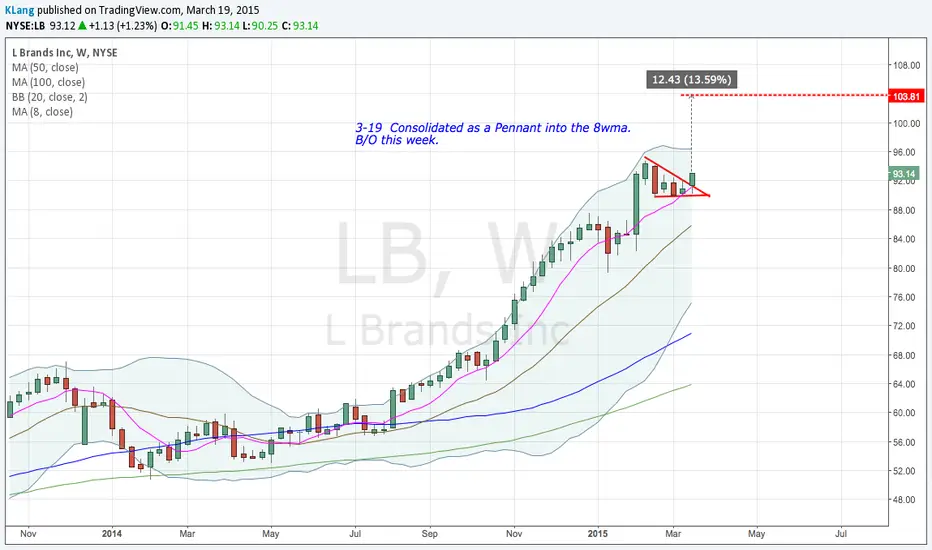
LBNotes on chart - I'm thinking wants the 100 market measured move, if my interpretation is correct is 103.81
LB bull flag confirmedLB has been trending up for several years but found resistance at the $50 half figure. At this price the trend stagnated a little - on the weekly chart we can see that the 50ma stopped acting as a solid support and was breached on several occasions for several weeks at a time. The trend continued but became less predictable to trade.
In mid-August 2014 another upward trend began but until it broke the December 2013 pivot high it was of no interest to longer-term trend traders. Then, after a couple of fake breakouts in September/October, November saw price trade above $70 which was an early opportunity to buy this stock.
More recently, however, a bullish flag began to form. This flag was confirmed on yesterdays breakout bar. If price continues its momentum to the upside another chance to buy LB could soon present itself.

Breaking out of resistanceMarket Perform at Wells Fargo recently upgraded LB to outperform.
Price has bounced off the 50 day MA and yesterday broke out of resistance. At present price is just below the figure 70 which might offer resistance but with the overall trend up on the monthly weekly and daily, we are looking for a continuation should price break the figure.
Price is above:
Resistance
Last years high
52 week high
50 and 200 moving average
Earnings are due mid November which is about 4 weeks from now.

