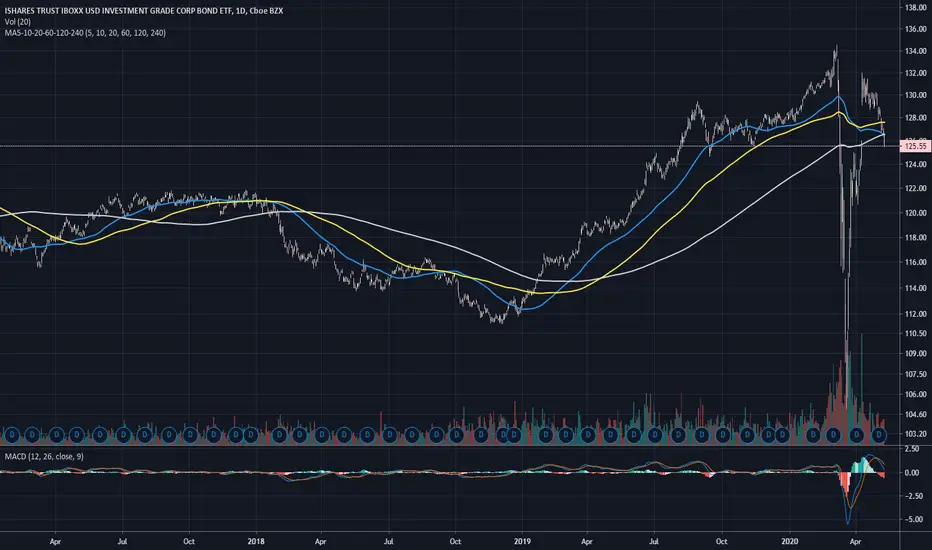
Scenarios for yield curve control.After the bull run (due to the cut of the interest rates and Quantitative easing from the FED), the LDQ ETF has been distributing since late July.
Historically, the 0.786 and the 0.618 retracements are an inflection point, where the previous trend reverses. We can see this pattern in all assets with an institutional interest.
Until now, the FED is letting the inflation expectations run to justify later the money printing and yield curve control. Therefore, I expect a five-wave impulse to the downside or maybe a big ZigZag around the retracements mentioned before.
LQD trade ideas


LQD begs for attention, and we better pay it someLQD is a $45 billion ETF holding bonds of over 2300 among the biggest and most prominent US corporate borrowers. It peaked last August, and the five month consolidation broke to the downside last week. Now it's clinging by the fingernails to the highs of last April, which are offering some semblance of support. If that gives way, a couple more supports can be found in the 126.50 to 127 area, with a weekly gap at 128.50 to fill along the way. Will it get so low? Will it stop falling if it gets there? Both credit and equity markets could be seriously affected by what LQD does... for better, or for worse! Keep an eye on that 132 support... you know what comes next... Just in case, better be prepared!

High Grade Corporate Bonds and GoldHigh Grade Bonds helps gold drive higher, but not required. What fuels those bonds seems to also fuel gold... Turbo mode witnessed when both breakout higher. #debt #gold #silver $slv $gld #fintwit $sil $silj $gdx $gdxj $lqd

Watch Corporate Bonds - Bond Selloff to Trickle into Stocks?LQD has just had 4 consecutive closes below the 21 ema, this may well be a sign of weakness in an already overextended market.
As you can see, LQD and the SPX have had a very tight correlation, particularly since the liquidity hose was turned on after the market crash in March. This is why a selloff in the bond markets, may very well forewarn of a potential correction (perhaps severe, perhaps just mean reversion).
This is made more concerning, with the selloff in HYG occurring in tandem with the selloff in LQD, the question i have is, what do the bond investors know that equity investors do not?
-TradingEdge

LQD: Follow the Fed? The key themes going into next week will be stimulus. The update from the federal reserve this week they showed they are purchasing high quality corporate ETF's (a new asset class for them) and amongst the ETF's being purchased was LQD . As you can see, it clearly benefited. For some that have been in the game for a while, front running the FED has never been our cup of tea, but the purchases of corporate bonds could be something that could be emulated successfully. The interest will be there, but I doubt that it's NOT already counted in.

LQDI know, dont find the Fed. But I was looking at this least week too and wondering how in the heck is it going to hold up. Trying to give it the benefit of the doubt: maybe bounce after the gap filled.. but so far does not look like it. Definitely one to watch at least for informational purpose if not to sell
LQD vs. SPYMay be looking too closely into this, but the 4hr ratio chart is breaking out from diagonal resistance and the RSI is forming a new high, all while not reaching oversold..


Who wants to counter trade the FED? Corporate debt is overvalued, propped up by the Federal Reserve
Bought some puts expiring end of May, hopefully the timing is right
Short term bearish, long term FED is op / not worth tryna short it to the ground

A comparison of LQD snap back rallies 2008-2009 and 2019-2020Short description:
Similarities between the 2008-2009 AMEX:LQD pullback and the 2020 AMEX:LQD pullback, paired with the subsequent snap back rallies from a technical standpoint. Looking at the comparisons between the two, the 2020 correction was about the same depth, however, the structural components of the correction were fundamentally different.
2008-2009 had the collapse of many small banks, auto makers, lenders, and two large banks (Lehman Bros and Bear Stearns).
2020 has not seen a complete collapse of similar proportions to support a lengthy correction, thus the snap back has occurred much faster. Additionally the fundamental difference is the change in swift policy and stimulus injections to stave off major components of what caused a deep and lengthy correction in the IG bond markets between 2008-2010.
While IG bond markets on a % basis didn't experience nearly the same crippling blow, the dollar value of the pull backs were similar. The overall structure of corporate debt now is probably similar if not slightly worse than in 2008-2010, however, the US banking sector is much better prepared for failures and defaults on loans with loan loss reserves covering roughly 10% of debt in the market.
-Fed policy shift
1) backstopping bond ETFs
2) unlimited repo activities
3) overall shift in macro strategy with fast actions and solve future problems after the fire is out
-Price action seems to follow stimulus and resumption of normal activities to a degree
1) large stimulus responses looked similar, and additional stimulus appears to spur activity in the bond market
2) IG bonds tend to stablize first following corrections and are first to move up followed by equities
-Increased supply of money appears to have a positive effect on credit markets
1) while in the moment, dollar scarcity has a large implication on pullbacks as well as on surges in price
2) when fiscal plumbing is corrected, the bond market is swift to add $10-$20 to price as the market is behaving naturally in the perpetual debt system.


$LQD - BESAT MODE$LQD - tagged the 50% fib on the monthly chart (ATL to ATH). Fib is projecting a move into $148.45 (keep in mind this a MONTHLY chart).

Corporate Bond market froze up last week LQD vs HYGchart of LQD-HYG last week before and after FED bailout


LQD ShortLQD just bucked a very important trend line. If investors have indeed lost confidence in corporate debt and we see follow through, then I see this as a bearish signal for stocks too. Typically the bond market is known to be correct over the equity market as large institutions with more knowledge than retail traders deal with bonds directly. To see corporate bonds give up such a well defined, key trend line, is to me a signal to be short not only on LQD but on the markets as a whole. Recently, the ramp up in stock prices was on very low volume and I can count 10 unfilled gaps on the SPY ETF. On the graph, there is one instance where we saw negative divergences but the price corrected in time rather than in price. Here, we could definitely see a correction in price as support now becomes resistance with the trend broken.
I am not taking a short position on LQD directly but I do recommend taking short positions on equities through investment vehicles such as SQQQ (-3 QQQ). I am also considering on buying UGLD (x3 gold) and TMF (x3 US treasuries) as a flight to safety emerges into those safe haven assets.

A symmetrical triangle in the ETF of LQDWe can observe a symmetrical triangle.
Depending on where the triangle breaks we will open a short or a long one, in this case the two operations are left on and as soon as one is activated we cancel the other, the profit taking we put it with the projection that gives us the triangle and we also put the stop loss.
Remember that it is possible to play a certain short or long symmetrical triangle from where it breaks.

$spy A little something for the bulls $lqd $jnkThis spread has been a good buy indicator when it hits this level. The problem is that stocks have gone up instead of down on this spread rise. is it different this time?

$spy $tlt $lqd This should be bulls biggest concernThere appears to be about a 1-2 month lag in $spy vs $lqd. If $lqd is topping here then you should be selling $spy as well. Lets see how it plays out

LQD BOND MARKET TOP TROUBLE AHEAD A VERY STRONG NON CONFIRMATION IN RSI IS NOW SETUP IN BOND MARKET SHOULD BE A NEG FOR STOCKS ?????

Short Investment Grade BondsAs inflation (measured by the CPI) accelerates into the back half of 2019, compression of real rates along with decelerating corporate earnings will put downward pressure on investment grade credit.

Confluence of coincidence: $LQDLast Oct I published a series of charts named “The preponderance of evidence”, I think it is time for a new series. I think the charts itself should be self explanatory. Feel free to drop me a line on what you think.
When 50% of IG bonds are BBB rated, 1 notch above junk, are you sure you are getting what you think you are buying? #lemonalert

LQD: Reversal at top of QE 4ever rangeLQD which tracks BBB-rated corporate bonds is reversing at the top of a a channel which started in 2012 when global central banks launched their QE forever campaign (Twist, Whatever it takes, ETF buying etc). You can see LQD break below a SSR near the top of a channel with negative short-term trend.
Lots of reasons to be bearish for corporate bonds, higher yields, more defaults and a slowing economy. #Watchoutbelow
