Short or Trim $LYFT- Shorting/Trimming position on NASDAQ:LYFT offers better risk/return at these levels.
- I would consider buying back close to support $10-11 range.
Next report date
—
Report period
—
EPS estimate
—
Revenue estimate
—
2.79 MXN
475.03 M MXN
120.63 B MXN
381.63 M
About Lyft, Inc.
Sector
Industry
CEO
John David Risher
Website
Headquarters
San Francisco
Founded
2007
FIGI
BBG00Q4372T8
Lyft, Inc. engages in the provision and management of an online social rideshare community platform. It offers access to a network of shared bikes and scooters for shorter rides and first mile and last-mile legs of multimodal trips, information about nearby public transit routes, and Lyft Rentals to offer riders a view of transportation options when planning any trip. The company was founded by Marcus Cohn, John Zimmer, Rajat Suri, Matt van Horn, and Logan Green in 2007 and is headquartered in San Francisco, CA.

LYFT Two-Stage Trade Plan
LYFT Two-Stage Trade Plan
Setup: Head & Shoulders Breakdown → Bull Flag Recovery
Based on analysis of multiple LYFT 15-minute and daily charts, we’ve identified a potential head and shoulders pattern forming with a neckline at $16.30. A breakdown below this level could trigger a short opportunit

LYFTThis name gapped up on earning and now showing a nice little flag. TBA $17 and first target $18:30

LYFT – High Tight Flag Setup Post Earnings BreakoutNASDAQ:LYFT – High Tight Flag Breakout Setup Post Earnings
LYFT has exploded on earnings and is now setting up a textbook high tight flag — one of my favorite continuation patterns.
🔹 Earnings Surge → Flag Formation
NASDAQ:LYFT followed a similar path to NYSE:HIMS , which ran to the 16s after

LYFT, 3D Daily Breakout Confirms Potential Mid-Term ReversalOn the 3-day chart of Lyft, price action is developing within a potential mid-term reversal structure. The key trigger was the breakout of the descending trendline on the daily timeframe, signaling a shift in momentum after an extended downtrend.
The asset bounced from the long-term ascending suppo

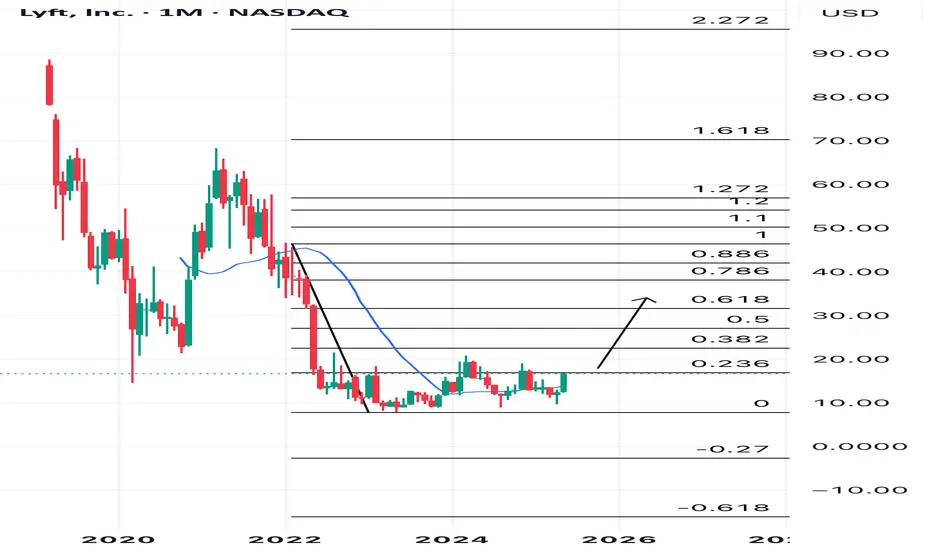
LYFT LONG📈 NASDAQ:LYFT Long-Term Bullish Thesis 🚀
I’m bullish on LYFT with a long-term price target in the $40–$45 range, supported by key Fibonacci extension levels and improving technical structure. The chart shows higher lows and increasing volume—both signs of accumulation and early-stage trend revers
LYFT stock is a grower and undervalued, future 10x ?LYFT stock is trading a low pe and has a potential smooth 25% annual growth rate to EPS for next years.
PE price /earnings is low at around 11.
More cash than debt on the balance sheet, making them a little cheaper.
easily should be worth 20-25 PE for a fair price. Growth rate should make LYFT

LYFT Stock Chart Fibonacci Analysis 042425Trading Idea
1) Find a FIBO slingshot
2) Check FIBO 61.80% level
3) Entry Point > 11.9/61.80%
Chart time frame: D
A) 15 min(1W-3M)
B) 1 hr(3M-6M)
C) 4 hr(6M-1year)
D) 1 day(1-3years)
Stock progress: A
A) Keep rising over 61.80% resistance
B) 61.80% resistance
C) 61.80% support
D) Hit the bottom

LYFT Stock Chart Fibonacci Analysis 032025Trading Idea
1) Find a FIBO slingshot
2) Check FIBO 61.80% level
3) Entry Point > 11.8/61.80%
Chart time frame: C
A) 15 min(1W-3M)
B) 1 hr(3M-6M)
C) 4 hr(6M-1year)
D) 1 day(1-3years)
Stock progress: A
A) Keep rising over 61.80% resistance
B) 61.80% resistance
C) 61.80% support
D) Hit the bottom

Lyft PUT option potential for weekly outlookPretty straight forward Lyft breaking through a lot of different Technical rules looking for it to continue down

See all ideas
Summarizing what the indicators are suggesting.
Neutral
SellBuy
Strong sellStrong buy
Strong sellSellNeutralBuyStrong buy
Neutral
SellBuy
Strong sellStrong buy
Strong sellSellNeutralBuyStrong buy
Neutral
SellBuy
Strong sellStrong buy
Strong sellSellNeutralBuyStrong buy
An aggregate view of professional's ratings.
Neutral
SellBuy
Strong sellStrong buy
Strong sellSellNeutralBuyStrong buy
Neutral
SellBuy
Strong sellStrong buy
Strong sellSellNeutralBuyStrong buy
Neutral
SellBuy
Strong sellStrong buy
Strong sellSellNeutralBuyStrong buy
Displays a symbol's price movements over previous years to identify recurring trends.
Curated watchlists where LYFT is featured.


Related stocks
Frequently Asked Questions
The current price of LYFT is 310.00 MXN — it hasn't changed in the past 24 hours. Watch LYFT INC stock price performance more closely on the chart.
Depending on the exchange, the stock ticker may vary. For instance, on BMV exchange LYFT INC stocks are traded under the ticker LYFT.
LYFT stock has fallen by −1.59% compared to the previous week, the month change is a 30.08% rise, over the last year LYFT INC has showed a 18.77% increase.
We've gathered analysts' opinions on LYFT INC future price: according to them, LYFT price has a max estimate of 413.74 MXN and a min estimate of 194.24 MXN. Watch LYFT chart and read a more detailed LYFT INC stock forecast: see what analysts think of LYFT INC and suggest that you do with its stocks.
LYFT reached its all-time high on Mar 8, 2021 with the price of 1,401.66 MXN, and its all-time low was 139.81 MXN and was reached on May 24, 2023. View more price dynamics on LYFT chart.
See other stocks reaching their highest and lowest prices.
See other stocks reaching their highest and lowest prices.
LYFT stock is 0.00% volatile and has beta coefficient of 1.35. Track LYFT INC stock price on the chart and check out the list of the most volatile stocks — is LYFT INC there?
Today LYFT INC has the market capitalization of 130.57 B, it has increased by 1.49% over the last week.
Yes, you can track LYFT INC financials in yearly and quarterly reports right on TradingView.
LYFT INC is going to release the next earnings report on Jul 30, 2025. Keep track of upcoming events with our Earnings Calendar.
LYFT earnings for the last quarter are 4.90 MXN per share, whereas the estimation was 3.88 MXN resulting in a 26.17% surprise. The estimated earnings for the next quarter are 5.01 MXN per share. See more details about LYFT INC earnings.
LYFT INC revenue for the last quarter amounts to 29.71 B MXN, despite the estimated figure of 30.08 B MXN. In the next quarter, revenue is expected to reach 31.32 B MXN.
LYFT net income for the last quarter is 52.59 M MXN, while the quarter before that showed 1.29 B MXN of net income which accounts for −95.91% change. Track more LYFT INC financial stats to get the full picture.
No, LYFT doesn't pay any dividends to its shareholders. But don't worry, we've prepared a list of high-dividend stocks for you.
As of May 29, 2025, the company has 2.93 K employees. See our rating of the largest employees — is LYFT INC on this list?
EBITDA measures a company's operating performance, its growth signifies an improvement in the efficiency of a company. LYFT INC EBITDA is 2.85 B MXN, and current EBITDA margin is 1.17%. See more stats in LYFT INC financial statements.
Like other stocks, LYFT shares are traded on stock exchanges, e.g. Nasdaq, Nyse, Euronext, and the easiest way to buy them is through an online stock broker. To do this, you need to open an account and follow a broker's procedures, then start trading. You can trade LYFT INC stock right from TradingView charts — choose your broker and connect to your account.
Investing in stocks requires a comprehensive research: you should carefully study all the available data, e.g. company's financials, related news, and its technical analysis. So LYFT INC technincal analysis shows the buy rating today, and its 1 week rating is buy. Since market conditions are prone to changes, it's worth looking a bit further into the future — according to the 1 month rating LYFT INC stock shows the buy signal. See more of LYFT INC technicals for a more comprehensive analysis.
If you're still not sure, try looking for inspiration in our curated watchlists.
If you're still not sure, try looking for inspiration in our curated watchlists.