LYFT - Bullish divergence on Weekly time frameLYFT has been in a crazy downtrend and it has lost over 90 % of its value from its ath.
However, things start looking interesting. We can see a bullish divergence on weekly time frame which suggest a sellers exhaustion.
However the downtrend is still in tact.
How to trade it?
You can enter long at the breakout of the falling wedge once we get it.
Entering long at 8 $ could be also a way as it's close to all time low that we saw in May 2023.
It would be also reasonable to buy at the downsloping support if the price goes so low.
Unfortunately fundamentals are not very good for LYFT therefore this trading idea is based SOLELY on the Technical analysis.
What do you think about LYFT? is it going to recover?
Share your opinion in the comment section.
P.S Make a note that all take profit levels are with a mid-term and long-term horizon.
Good luck
LYFT trade ideas

Buy LYFT @ 11 - 11.20 Excellent breakout around $11. You can invest 2-3% of your portfolio with stop loss @ 7.55 and risk with 0.5% of your portfolio.

Lyft's Earnings Error Sends Stock Soaring, But Reality BitesLyft ( NASDAQ:LYFT ) sent shockwaves through the trading floor with a monumental error in its earnings forecast, triggering a rollercoaster ride for investors. The company's stock skyrocketed an impressive 16% in premarket trading, only to reveal a stark correction that left analysts and traders alike reeling.
The drama unfolded when Lyft ( NASDAQ:LYFT ) initially reported a jaw-dropping 500 basis point expansion in its adjusted earnings margin for 2024. The market erupted with enthusiasm, propelling Lyft's ( NASDAQ:LYFT ) shares to stratospheric heights, with an over 60% surge in extended trading. However, the euphoria was short-lived as reality dealt a harsh blow – the correct figure stood at a mere 50 basis points, a fraction of the initially announced increase.
Chief Financial Officer Erin Brewer's admission of the error during the earnings call punctured the bubble of optimism that had enveloped investors. Yet, despite the correction, Lyft ( NASDAQ:LYFT ) managed to retain a significant portion of its gains, a testament to the underlying strength of its performance.
Behind the scenes, Lyft's financials tell a compelling story of resilience and growth. The company defied expectations by swinging from a staggering $416.5 million loss to a remarkable $222.4 million profit in full-year adjusted earnings before interest, taxes, depreciation, and amortization (EBITDA). This turnaround underscores Lyft's ability to navigate challenges and capitalize on opportunities in an ever-evolving market landscape.
Analysts at TD Cowen echoed this sentiment, highlighting Lyft's fourth-quarter revenue beat driven by robust gross bookings. Additionally, Lyft's EBITDA guidance surpassed expectations, further bolstering investor confidence. In response, TD Cowen raised their target price on the stock, reflecting a bullish outlook on Lyft's future prospects.
Despite the turbulence caused by the forecasting error, Lyft's performance remains a beacon of strength in the competitive ride-hailing industry. The company's ability to adapt and innovate in the face of adversity cements its position as a formidable player in the market.
Looking ahead, investors will undoubtedly scrutinize Lyft's future earnings releases with heightened scrutiny, mindful of the potential for discrepancies. However, amidst the volatility lies an opportunity for those willing to ride the waves of uncertainty, betting on Lyft's continued resilience and growth trajectory.

LYFT Week of Jan 8Last request, LYFT.
Based on HA candles, it has not finished its short retracement yet:
TP in yellow.
Watch for the threshold break and pay attention to the HA target price as well, as it can act as support.
Safe trades!

Lyft if survives the recession.NASDAQ:LYFT
Looks like Lyft at -2.2PE and 3.32 market cap is really undervalued.
If this company survives the upcoming recession, then it is going to return massive gains.
Huge gaps, it follows technicals and imagining the future of self driving cars around 2026, this stock looks very attractive.(only if they embrace.)
DCA is best option, leaps are also best option if the premium is cheap.

Support held during sell offI like how the support held during the sell off last week. Start with a small position, it may take a few days to consolidate before going higher. Also it can pull back during consolidation.
SL below the right shoulder, wait for the weekly candle to close. Calls options are not expensive and always a good option with high volatility stocks like this one. But give it time, expiration 2 months from now.

LYFT^ earningslyft earnings are coming up this could be catalysis that pushes the asset over the 200day Moving average

LYFT in a bearish channel.LYFT Inc - 30d expiry - We look to Sell at 11.99 (stop at 12.91)
Trading within a Bearish Channel formation.
The sequence for trading is lower lows and highs.
The primary trend remains bearish.
Preferred trade is to sell into rallies.
The trend of lower highs is located at 12.00.
Our profit targets will be 9.81 and 9.41
Resistance: 11.53 / 12.00 / 12.45
Support: 10.75 / 10.30 / 9.72
Please be advised that the in formation presented on TradingView is provided to Vantage (‘Vantage Global Limited’, ‘we’) by a third-party provider (‘Everest Fortune Group’). Please be reminded that you are solely responsible for the trading decisions on your account. There is a very high degree of risk involved in trading. Any information and/or content is intended entirely for research, educational and informational purposes only and does not constitute investment or consultation advice or investment strategy. The information is not tailored to the investment needs of any specific person and therefore does not involve a consideration of any of the investment objectives, financial situation or needs of any viewer that may receive it. Kindly also note that past performance is not a reliable indicator of future results. Actual results may differ materially from those anticipated in forward-looking or past performance statements. We assume no liability as to the accuracy or completeness of any of the information and/or content provided herein and the Company cannot be held responsible for any omission, mistake nor for any loss or damage including without limitation to any loss of profit which may arise from reliance on any information supplied by Everest Fortune Group

Selling LYFT at trend of lower highs.LYFT Inc - 30d expiry - We look to Sell at 12.35 (stop at 13.25)
The primary trend remains bearish.
Trading has been mixed and volatile.
This stock has seen poor sales growth.
The trend of lower highs is located at 12.40.
We look for a temporary move higher.
Preferred trade is to sell into rallies.
Our profit targets will be 10.15 and 9.65
Resistance: 11.30 / 12.00 / 12.79
Support: 10.56 / 10.14 / 9.50
Please be advised that the in formation presented on TradingView is provided to Vantage (‘Vantage Global Limited’, ‘we’) by a third-party provider (‘Everest Fortune Group’). Please be reminded that you are solely responsible for the trading decisions on your account. There is a very high degree of risk involved in trading. Any information and/or content is intended entirely for research, educational and informational purposes only and does not constitute investment or consultation advice or investment strategy. The information is not tailored to the investment needs of any specific person and therefore does not involve a consideration of any of the investment objectives, financial situation or needs of any viewer that may receive it. Kindly also note that past performance is not a reliable indicator of future results. Actual results may differ materially from those anticipated in forward-looking or past performance statements. We assume no liability as to the accuracy or completeness of any of the information and/or content provided herein and the Company cannot be held responsible for any omission, mistake nor for any loss or damage including without limitation to any loss of profit which may arise from reliance on any information supplied by Everest Fortune Group

Lyft Showing signs of Life, have we Bottomed?Hi guys! Welcome to an analysis on macro developments of Lyft (LYFT). With the markets doing what they've been doing this year, we have to ask, " Will the % gains come to stocks that are still many many % down from their tops"? Or are some stocks just doomed to fizzle out and take time to re-build/ grow?
Well, if we are in a Bull market, which i personally think we are... Assets with Solid Market Structure & Technicals will also be included into the liquidity being injected into the markets.
Taking a glance under the hood with LYFT, i can see some promising developments playing out. Making me consider LYFT as a Long play.
This analysis is strictly on Technicals and is on the 1 Week timeframe to get a big picture view.
So lets look at Price Action:
Last week candle has broken ABOVE the Major Resistance trendline which has worked to cause Price Declines since November 2021
Notice how we've had many touch points on this Resistance line in RED.
I believe it to have been weakened, thus the current BREAKOUT.
Do we go back to print All Time Highs now? Absolutely NOT.
It requires alot of energy or momentum to break major trends.
But its the 1st step to the road of getting back to all time highs.
We also need Confirmation before anything. This 1 candle is not enough, though an extremely BULLISH candle, a Bullish ENGULFING candle. Which is a great sign and pushs probabilities for confirmation as well.
But we need to now Test the Resistance line as SUPPORT.
With the overlaying Resistance line ABOVE us, i believe we will get a push down to the Support Test.
But so far the break out to me is promising:
Why? Look to the Volume for clues. We are so far seeing increased volume. It is important that it continues.
If at the end of this week, you see Volume has declined. We would need to reassess the breakout, as that would potentially mean this could be a Fakeout.
So getting ABOVE Major Multi year resistance, would support the idea of Trend Change/ perhaps Trend Reversal and a sign hinting that the Bottom is in.
Another Bottoming sign observed = BULLISH DIVERGENCE being spotted.
This is when Price Action prints Lower Lows BUT Indicators print Higher Lows.
Seen in the RSI -> Notice if and when we get above the Resistance line, we will see large % gains.
Another indicator to watch would be the STOCH RSI, as we are getting close to a BULLISH CROSS. If we get it, we will see bullish momentum come in, perhaps pushing prices above this horizontal resistance line.
Anyway i think things are hinting at the idea that we have bottomed. We are in a critical moment for LYFT and we must continue to monitor this week and more.
__________________________________________________________________________________
Thank you for taking the time to read my analysis. Hope it helped keep you informed. Please do support my ideas by boosting, following me and commenting. Thanks again.
Stay tuned for more updates on LYFT in the near future.
If you have any questions, do reach out. Thank you again.
DISCLAIMER: This is not financial advice, i am not a financial advisor. The thoughts expressed in the posts are my opinion and for educational purposes. Do not use my ideas for the basis of your trading strategy, make sure to work out your own strategy and when trading always spend majority of your time on risk management strategy.

LYFT - Formed AB=CD PatternLYFT has formed a bullish AB=CD Harmonic pattern along with the bullish divergence. We will be looking at point D for a potential reversal.

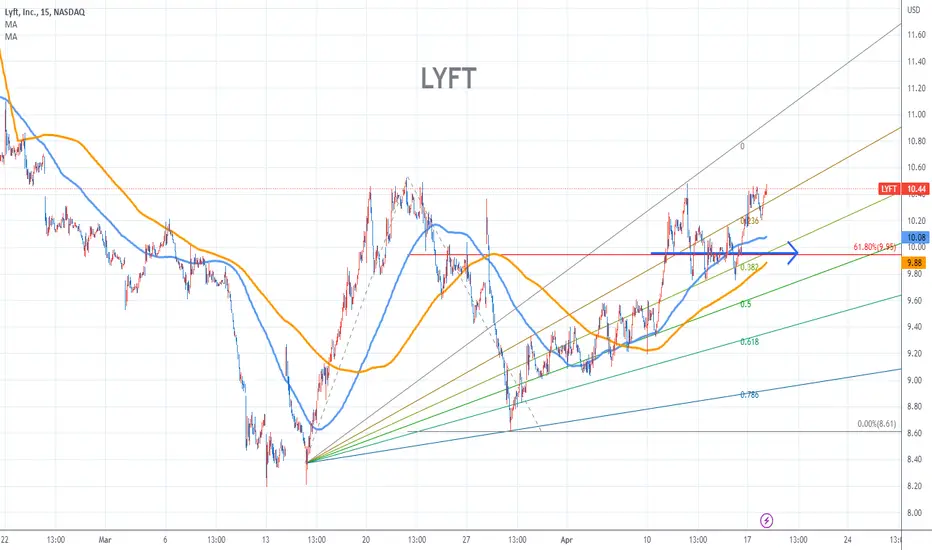
LYFT Stock Chart Fibonacci Analysis 082023 Trading Idea
1) Find a FIBO slingshot
2) Check FIBO 61.80% level
3) Entry Point > 10.8/61.80%
Chart time frame : B
A) 15 min(1W-3M)
B) 1 hr(3M-6M)
C) 4 hr(6M-1year)
D) 1 day(1-3years)
Stock progress : A
A) Keep rising over 61.80% resistance
B) 61.80% resistance
C) Hit the bottom
D) Hit the top
Stocks rise as they rise from support and fall from resistance. Our goal is to find a low support point and enter. It can be referred to as buying at the pullback point. The pullback point can be found with a Fibonacci extension of 61.80%. This is a step to find entry level. 1) Find a triangle (Fibonacci Speed Fan Line) that connects the high (resistance) and low (support) points of the stock in progress, where it is continuously expressed as a Slingshot, 2) and create a Fibonacci extension level for the first rising wave from the start point of slingshot pattern.
When the current price goes over 61.80% level , that can be a good entry point, especially if the SMA 100 and 200 curves are gathered together at 61.80%, it is a very good entry point.
As a great help, tradingview provide these Fibonacci speed fan lines and extension levels with ease. So if you use the Fibonacci fan line, the extension level, and the SMA 100/200 curve well, you can find an entry point for the stock market. At least you have to enter at this low point to avoid trading failure, and if you are skilled at entering this low point, with fibonacci6180 technique, your reading skill to chart will be greatly improved.
If you want to do day trading, please set the time frame to 5 minutes or 15 minutes, and you will see many of the low point of rising stocks.
If want to prefer long term range trading, you can set the time frame to 1 hr or 1 day.

LYFT to16Taking a look at LYFT, it seems like it’s following a channel that kicked off from the year’s low. This could be setting the stage for a potential gap fill around $16 over the next couple of months. If you’re considering getting in on this, remember to play it safe with a tight stop-loss!

LYFTis LYFT ready to fill the gap?
price action indicate consolidation above resistance
with the right catalyst price could go a lot higher
targets on chart

$LYFT Gap Fill Looking for the gap fill at $16
Trying some 13 calls for .28 and 12.5 calls for .43 7/28

$LYFT is something brewing.?May be a potential breakout, seeing the double bottom and support at fib 50% level.
No position yet.

$LYFT getting ready to $LFFT offBullish divergence on the annual time frame, that spans across a 2 year period.
Stochastic indicating the market is over sold on the annual time frame and that bulls are re entering the market.
RSI indicating market exhaustion to the downside and bulls returning to the market,
LYFT market dominance in the self driving/ ride sharing app is growing. Also with the expansion of self driving, company expense will drop and profits will rise.

LYFT PullbackI think LYFT is in it's pullback and once it breaks out of this, we can enter calls for good gains.

Bias more on upside for Lyft (short term)22nd April 2023
Resistance - $11.50/$13/ HKEX:16
Support - $9.50
Layoff bring positive sentiment.
However earning next week will be important to see how much benefit does it bring to the saving of cost for lyft with 2 round of layoff previously

LYFT Stock Chart Fibonacci Analysis 041723 Trading Idea
1) Find a FIBO slingshot
2) Check FIBO 61.80% level
3) Entry Point > 9.95/61.80%
LYFTAdded BJ Key Levels to this NASDAQ:LYFT chart, along with 20/50/100/200 EMA's.
1) Above the 20 EMA
2) Breaking a respected down trend
3) Approaching the Point Of Control on the Daily time frame.
I will be looking for a entry if price breaks above the next important EMA (50 in this case) with an increase of volume. If an entry is taken above the 50ema I will extremely cautious until we get conformation above the POC. My entry will most likely be a break above 10.57 with a warning of the level of 10.92 , If we push past that its a Blue Sky Breakout IMO.
The safest trade here would be waiting for $12.65 then riding it to the 200EMA.

LYFT me up, please! Where do you go from here?
Fib circles say we might get a nice curl up to the 16.00 range. I don't live in a area where ride sharing is a popular means of travel so I don't know what this company is doing right / wrong. Id like to dig into to LYFT and see if they are making any changes to increase use, and ultimately increasing the stock price. Love to colab with someone on a stock digging into financials and seeing what's on the horizon for a company. Lets put a play together!

LYFT, lyfting off soon....DAILY chart suggests a clear shifting price movement..
on Weekly, a divergence line is also happening.
Spotted at 9.27
Initial target is 15.00
SL at 8
TAYOR.
