mastercard analysing chart matercard market going down in 15 min chart and i guss the next candle will be red
MA trade ideas


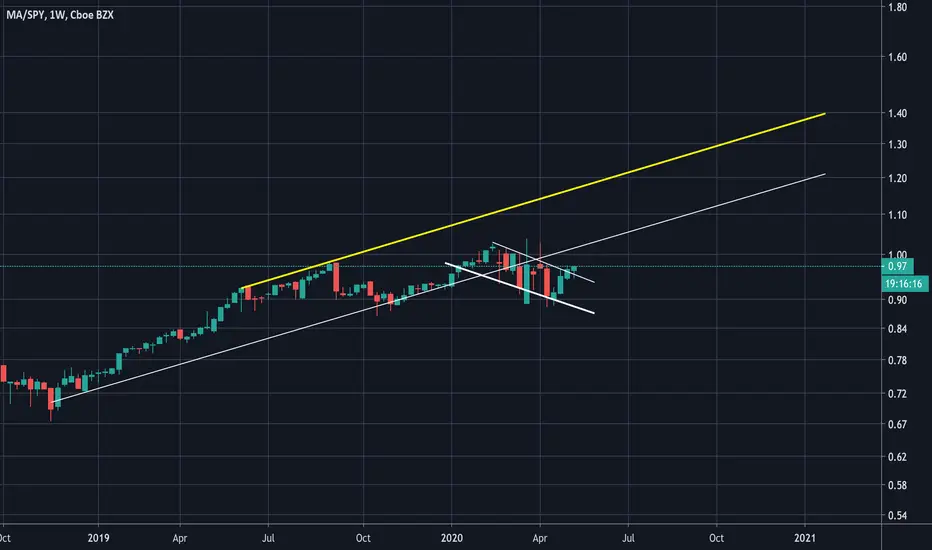
$ma ascending triangle bouncing off old resistance$ma bouncing off new support after breaking out of major resistance. Opportunity to buy we'll see 315-320 not too long now

MA Waiting for More Volume TriggerPrice Side:
#Rising price with good trend channel
#Price supporting with good sight
#Trend Line as price defense
#Exit if price drop
#Trade with care
Volume Side:
#Flag for waiting volume trigger
#Volume showing average
#Expecting more rising volume
#Exit if volume drop
#Trade with care
*Disclaimer : This is Not Financial Advice

MA - MASTERCARD INCOPORATE UP AGAIN50% for all predicting.
- Risk: 1%.
- Data backtest: Dafault from Tradingview.
- Good luck.


daily technical analysis of MASTERCARD INCORPORATEDHi friends
the graph of this day market shows with a very high probability that it will experience an uptrend because it broke the median line with force
please subscribe to my profile for more information
cordially

Buy signal for MASTERCARD INCORPORATEDBreaking a miner downtrend, with a reasonable volume, RSI also above 50, which is a good buying momentum sign.


Long MAKeep your trading simple
Bullish Long Term
T1 = minimum risk reward 1:1
I always leave 1/3 of my position for long term gains - moving my stop to my entry if I need to give room for the volatility or using trailing stop for maximum gains.
Not a financial advise - trade smart trade safe.
Follow me to support my work, Thanks!

Long MA - Second chance entry!Keep your trading simple
Bullish Long Term - After closing profits on the first trade on MA now we have anther trading opportunity!
Long term target $335 - Closing gap.
T1 = minimum risk reward 1:1
I always leave 1/3 of my position for long term gains - moving my stop to my entry if I need to give room for the volatility or using trailing stop for maximum gains.
Not a financial advise - trade smart trade safe.
Follow me to support my work, Thanks!

MASTERCARD Now is in BUY SituationHey traders, must see how mastercard reacts on fibonacci it may come back to break with force ...
Please LIKE & FOLLOW, thank you!


MA - Gap And GoMA broke above resistance at 285$ on a strong gap and go
stock consolidated last few weeks creating ascending triangle pattern

cautiously optomisticOBV is flat with increasing price. This looks like a stronger play for a break out than V, IMO. But not real strong.
Visa has a diverging OBV and looks less likely to break out.
WHo knows, we shall see.


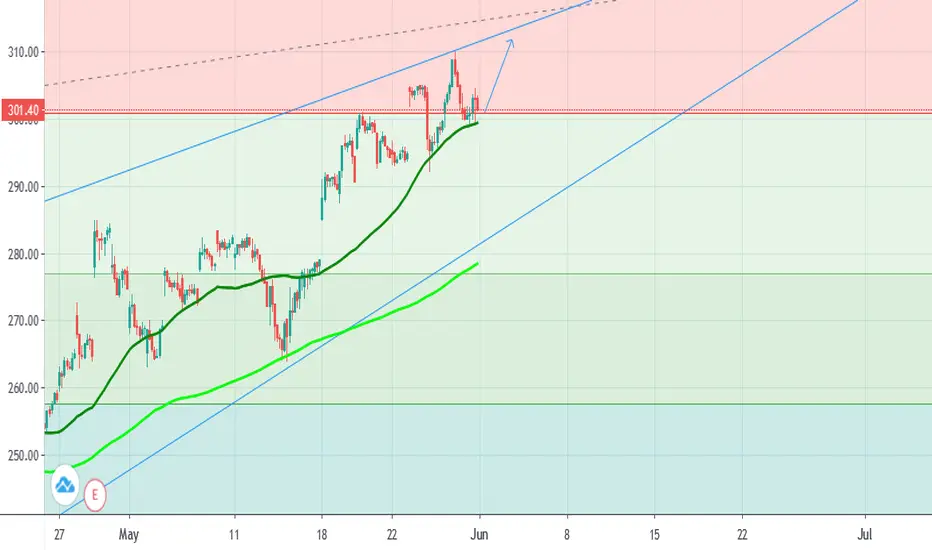
Mastercard: Another Triangle in Big TechSometimes people forget that the credit-card companies are members of the technology sector, but they are. We’ve already covered the bullish triangles in other tech names like Microsoft and Salesforce.com . And now Mastercard is showing a similar pattern.
MA has faced resistance around $282, which closely matches its 200-day simple moving average (SMA). Meanwhile it’s made steadily higher lows, forming an almost perfect ascending triangle.
The other interesting thing about MA is that it’s so clearly tied to consumer spending and the economy. That could make it a logical go-to stock for institutional investors as the coronavirus lockdowns end. It’s also a liquid options underlier, averaging more than 30,000 options contracts per session.
Looking at the weekly chart, we see MA has formed two inside weeks in a row. Combined with the April monthly high and the 200-day SMA, there’s a lot of importance in the $282-285 area. This creates the potential for buyers to get more active if it starts to break through this zone.
This is one to watch as the global economy reopens.